Stop plotting your data - annotate your data and let it visualize itself.
HoloViews is an open-source Python library designed to make data analysis and visualization seamless and simple. With HoloViews, you can usually express what you want to do in very few lines of code, letting you focus on what you are trying to explore and convey, not on the process of plotting.
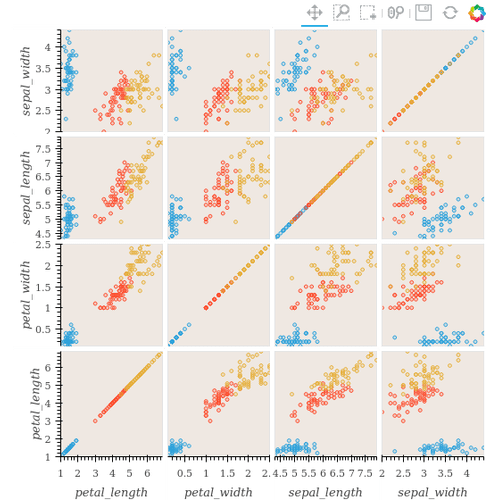
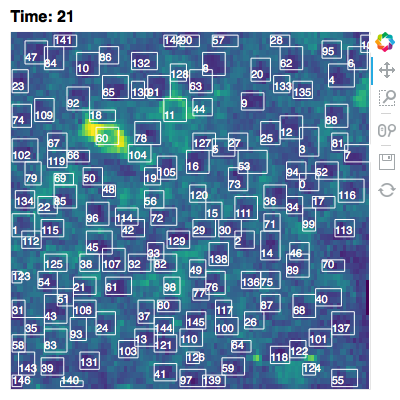
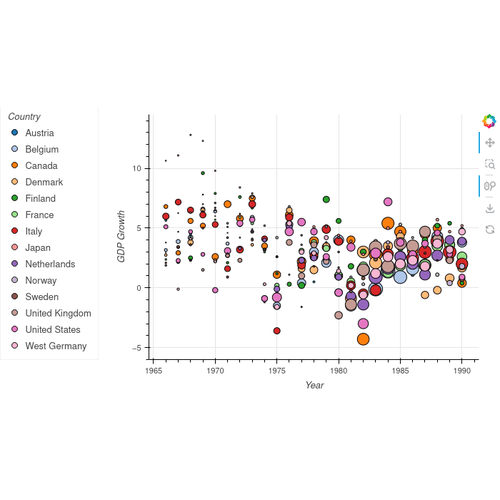
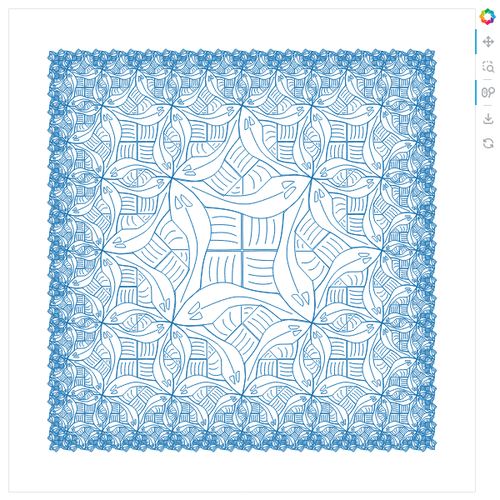
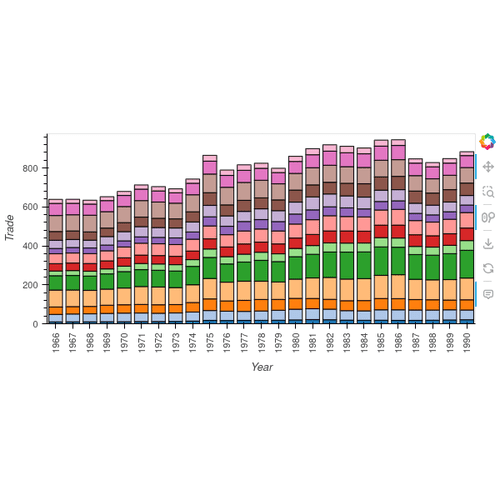
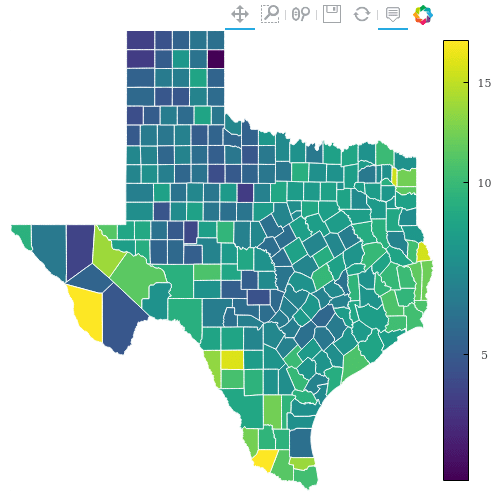
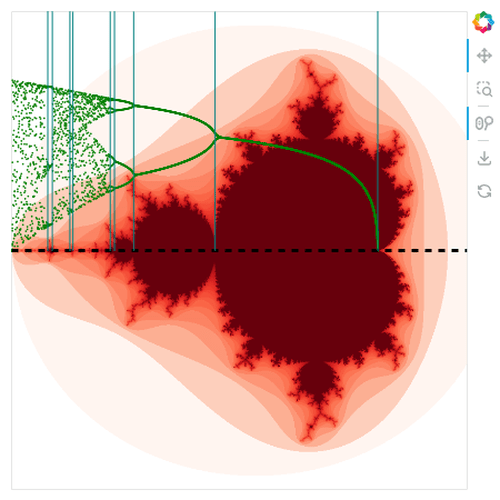
For examples, check out the thumbnails below and the other items in the Gallery of demos and apps and the Reference Gallery that shows every HoloViews component. Be sure to look at the code, not just the pictures, to appreciate how easy it is to create such plots yourself!
The Getting-Started guide explains the basic concepts and how to start using HoloViews, and is the recommended way to understand how everything works.
The User Guide goes more deeply into key concepts from HoloViews, when you are ready for further study.
The API is the definitive guide to each HoloViews
object, but the same information is available more conveniently via the
hv.help() command and tab completion in the Jupyter notebook.
If you have any issues or wish to contribute code, you can visit our GitHub site, file a topic on the HoloViz Discourse, or ask a quick question on Holoviz Discord.