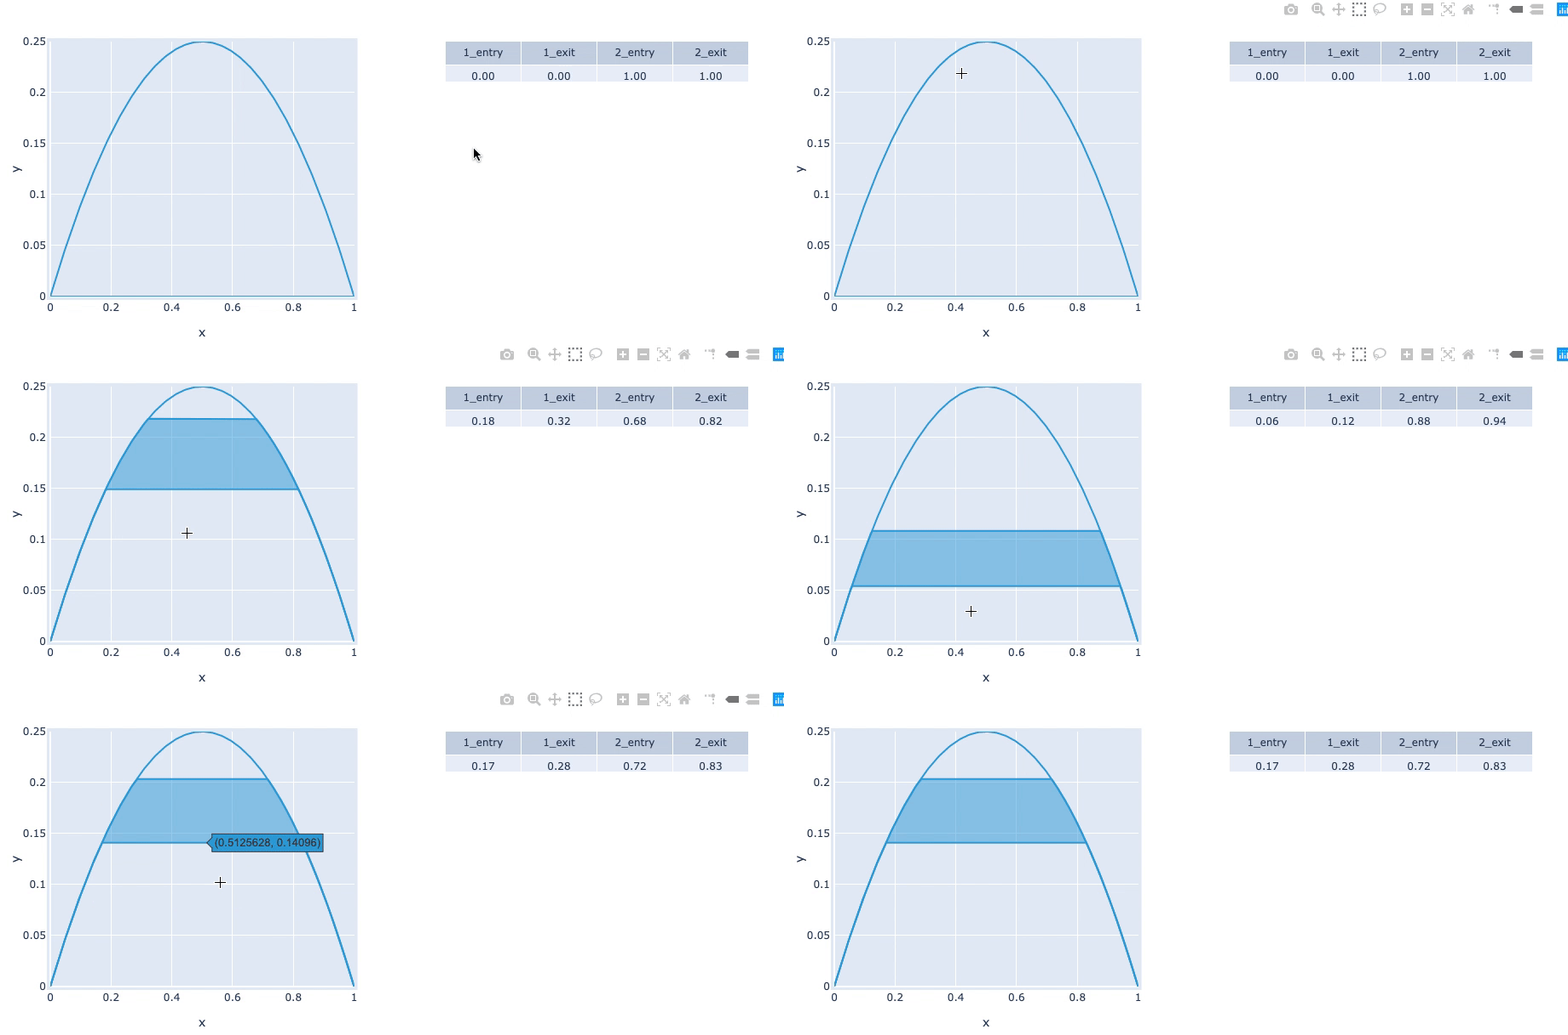
BoundsY#
Download this notebook from GitHub (right-click to download).
Title: BoundsY stream example#
Description: A linked streams example demonstrating how to use BoundsY streams.
Dependencies Plotly
import numpy as np

import holoviews as hv
from holoviews import streams

hv.extension('plotly')
xs = np.linspace(0, 1, 200)
ys = xs*(1-xs)
curve = hv.Curve((xs,ys))
scatter = hv.Scatter((xs,ys)).opts(size=1)

bounds_stream = streams.BoundsY(source=curve,boundsy=(0,0))

def make_area(boundsy):
    return hv.Area((xs, np.minimum(ys, boundsy[0]), np.minimum(ys, boundsy[1])), vdims=['min','max'])


def make_items(boundsy):
    times = [f"{x:.2f}" for x in sorted(np.roots([-1,1,-boundsy[0]])) + sorted(np.roots([-1,1,-boundsy[1]]))]
    return hv.ItemTable(sorted(zip(['1_entry', '2_exit', '1_exit', '2_entry'], times)))

area_dmap = hv.DynamicMap(make_area, streams=[bounds_stream])
table_dmap = hv.DynamicMap(make_items, streams=[bounds_stream])

(curve * scatter * area_dmap + table_dmap)

This web page was generated from a Jupyter notebook and not all interactivity will work on this website. Right click to download and run locally for full Python-backed interactivity.
Download this notebook from GitHub (right-click to download).
