Streaming Psutil#
Download this script from GitHub (right-click to download).
import pandas as pd
import panel as pn
import psutil
import holoviews as hv
from holoviews import dim, opts
hv.extension("bokeh")
# Define functions to get memory and CPU usage
def get_mem_data():
vmem = psutil.virtual_memory()
df = pd.DataFrame(
dict(free=vmem.free / vmem.total, used=vmem.used / vmem.total), index=[pd.Timestamp.now()]
)
return df * 100
def get_cpu_data():
cpu_percent = psutil.cpu_percent(percpu=True)
df = pd.DataFrame(list(enumerate(cpu_percent)), columns=["CPU", "Utilization"])
df["time"] = pd.Timestamp.now()
return df
# Define DynamicMap callbacks returning Elements
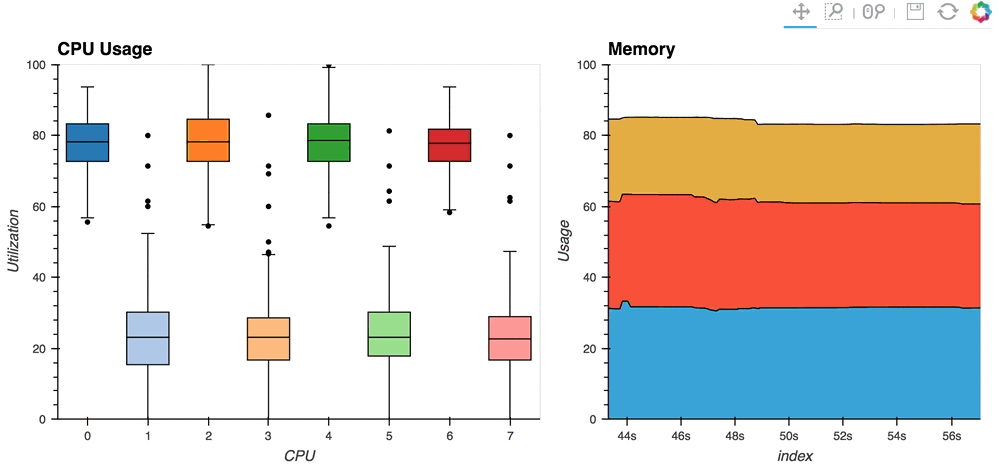
def mem_stack(data):
data = pd.melt(data, "index", var_name="Type", value_name="Usage")
areas = hv.Dataset(data).to(hv.Area, "index", "Usage")
return hv.Area.stack(areas.overlay()).relabel("Memory")
def cpu_box(data):
return hv.BoxWhisker(data, "CPU", "Utilization", label="CPU Usage")
# Set up StreamingDataFrame and add async callback
cpu_stream = hv.streams.Buffer(get_cpu_data(), 800, index=False)
mem_stream = hv.streams.Buffer(get_mem_data())
# Define DynamicMaps and display plot
cpu_dmap = hv.DynamicMap(cpu_box, streams=[cpu_stream])
mem_dmap = hv.DynamicMap(mem_stack, streams=[mem_stream])
plot = (cpu_dmap + mem_dmap).opts(
opts.Area(height=400, width=400, ylim=(0, 100), framewise=True),
opts.BoxWhisker(
box_fill_color=dim("CPU").str(), cmap="Category20", width=500, height=400, ylim=(0, 100)
),
)
# Create PeriodicCallback which run every 500 milliseconds
def cb():
cpu_stream.send(get_cpu_data())
mem_stream.send(get_mem_data())
callback = pn.io.PeriodicCallback(callback=cb, period=500)
callback.start()
# Show plot inside notebook
plot # noqa: B018