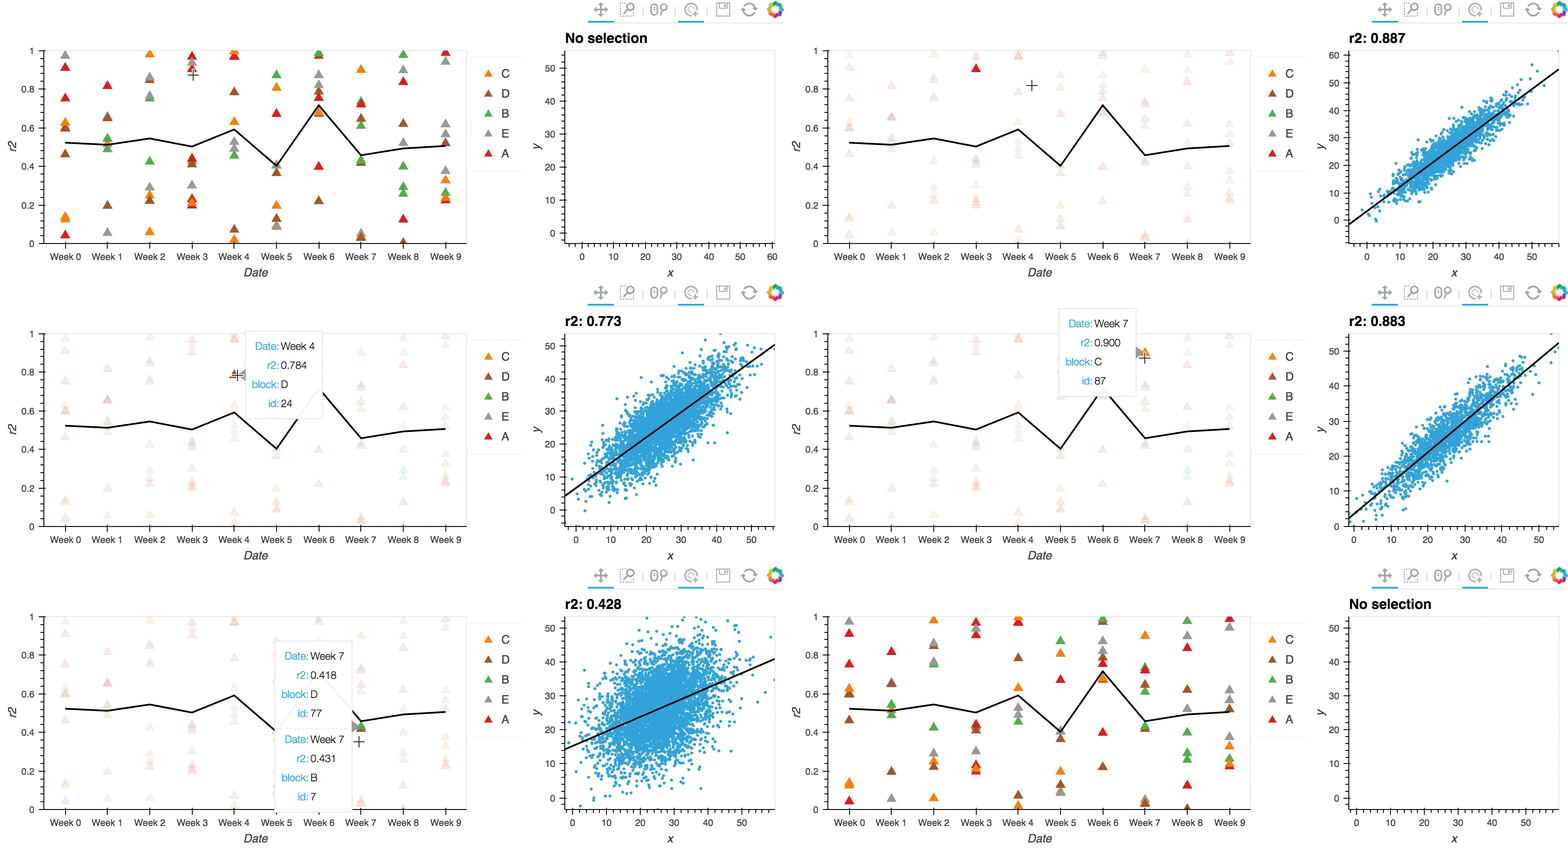
Selection1D Tap#
Download this notebook from GitHub (right-click to download).
Title: Regression selection#
Description: A linked streams example demonstrating how to the Selection1D stream to tap on a datapoint and reveal a regression plot. Highlights how custom interactivity can be used to reveal more information about a dataset.
Dependencies: Bokeh, SciPy
Backends: Bokeh
import random

import numpy as np
from scipy import stats

import holoviews as hv
from holoviews import opts
from holoviews.streams import Selection1D

hv.extension('bokeh')
def gen_samples(N, corr=0.8):
    xx = np.array([-0.51, 51.2])
    yy = np.array([0.33, 51.6])
    means = [xx.mean(), yy.mean()]
    stds = [xx.std() / 3, yy.std() / 3]
    covs = [[stds[0]**2          , stds[0]*stds[1]*corr],
            [stds[0]*stds[1]*corr,           stds[1]**2]]

    return np.random.multivariate_normal(means, covs, N)

data = [(f'Week {i % 10}', random.random(), random.choice("ABCDE"), i) for i in range(100)]
sample_data = hv.NdOverlay({i: hv.Points(gen_samples(np.random.randint(1000, 5000), r2))
                            for _, r2, _, i in data})
points = hv.Scatter(data, 'Date', ['r2', 'block', 'id']).redim.range(r2=(0., 1))
stream = Selection1D(source=points)
empty = (hv.Points(np.random.rand(0, 2)) * hv.Slope(0, 0)).relabel('No selection')

def regression(index):
    if not index:
        return empty
    scatter = sample_data[index[0]]
    xs, ys = scatter['x'], scatter['y']
    slope, intercep, *_ = stats.linregress(xs, ys)
    return (scatter * hv.Slope(slope, intercep)).relabel(f'r2: {slope:.3f}')

reg = hv.DynamicMap(regression, kdims=[], streams=[stream])

average = hv.Curve(points, 'Date', 'r2').aggregate(function=np.mean)
layout = points * average + reg
layout.opts(
    opts.Curve(color='black'),
    opts.Slope(color='black', framewise=True),
    opts.Scatter(color='block', tools=['tap', 'hover'], width=600,
                 marker='triangle', cmap='Set1', size=10, framewise=True),
    opts.Points(frame_width=250),
    opts.Overlay(toolbar='above', legend_position='right')
)

This web page was generated from a Jupyter notebook and not all interactivity will work on this website. Right click to download and run locally for full Python-backed interactivity.
Download this notebook from GitHub (right-click to download).
