Box Draw Roi Editor#
Download this notebook from GitHub (right-click to download).
import numpy as np

import holoviews as hv
from holoviews import opts, streams

hv.extension('bokeh')
Declaring data#
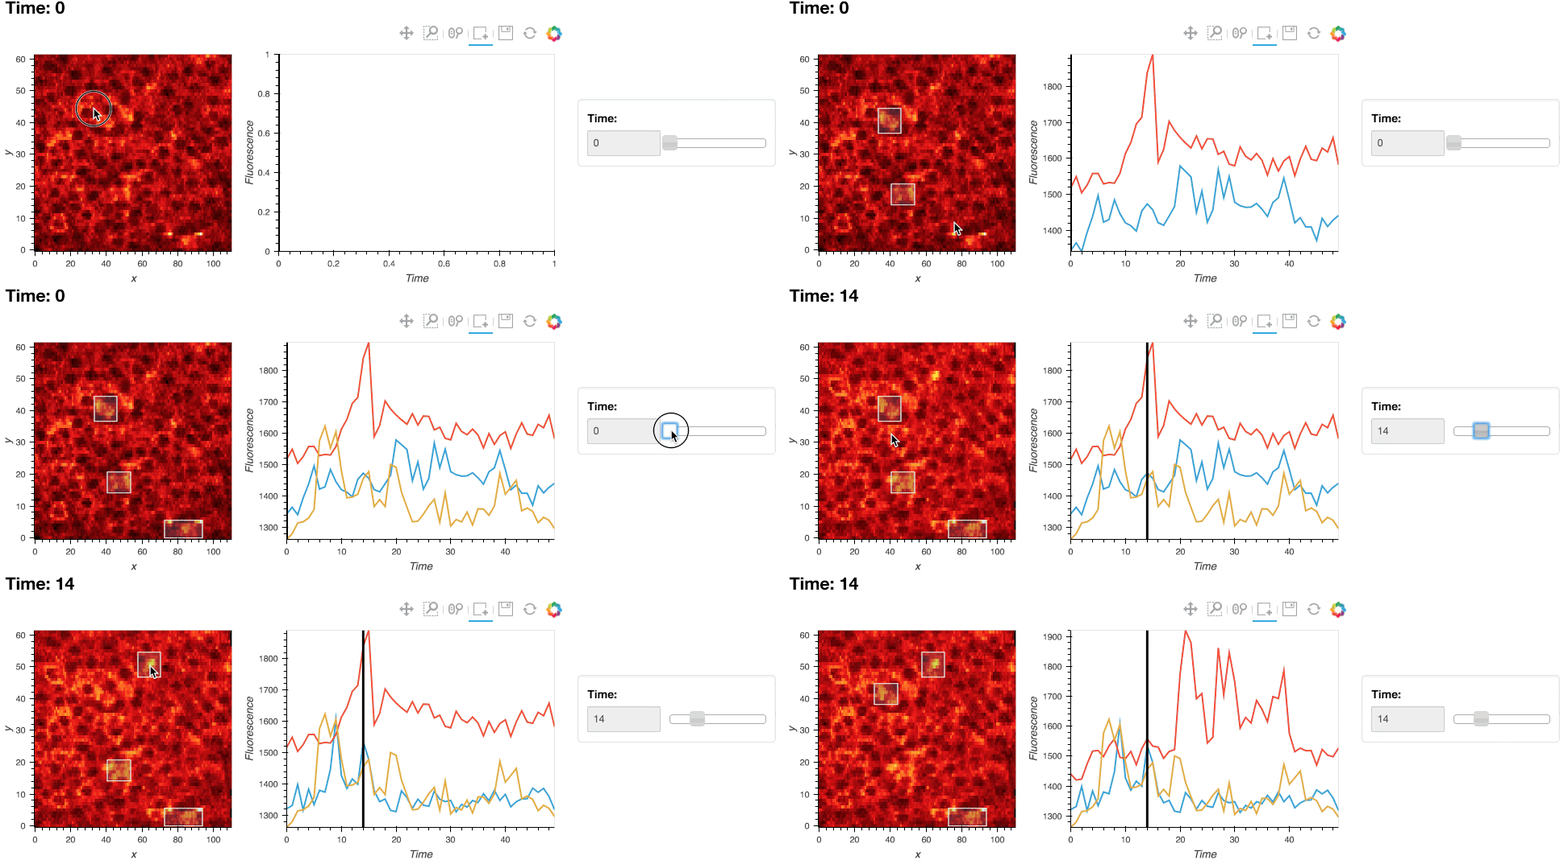
In this example we will use the BoxDraw stream to draw ROIs over a set of neural calcium imaging data, and use them to compute and display timeseries of the activity in the regions of interests.
data = np.load('../../../assets/twophoton.npz')
calcium_array = data['Calcium']
ds = hv.Dataset((np.arange(50), np.arange(111), np.arange(62), calcium_array),
                ['Time', 'x', 'y'], 'Fluorescence')

polys = hv.Polygons([])
box_stream = streams.BoxEdit(source=polys)

def roi_curves(data):
    if not data or not any(len(d) for d in data.values()):
        return hv.NdOverlay({0: hv.Curve([], 'Time', 'Fluorescence')})

    curves = {}
    data = zip(data['x0'], data['x1'], data['y0'], data['y1'])
    for i, (x0, x1, y0, y1) in enumerate(data):
        selection = ds.select(x=(x0, x1), y=(y0, y1))
        curves[i] = hv.Curve(selection.aggregate('Time', np.mean))
    return hv.NdOverlay(curves)

hlines = hv.HoloMap({i: hv.VLine(i) for i in range(50)}, 'Time')
dmap = hv.DynamicMap(roi_curves, streams=[box_stream])
Plot#
To define an ROI, select the ‘Box edit’ tool and double click to start defining the ROI and double click to finish placing the ROI:
im = ds.to(hv.Image, ['x', 'y'], dynamic=True)
(im * polys + dmap * hlines).opts(
    opts.Curve(width=400, framewise=True),
    opts.Polygons(fill_alpha=0.2, line_color='white'),
    opts.VLine(color='black'))

This web page was generated from a Jupyter notebook and not all interactivity will work on this website. Right click to download and run locally for full Python-backed interactivity.
Download this notebook from GitHub (right-click to download).
