holoviews.mpl Package#
mpl Package#
annotation Module#
- class holoviews.plotting.mpl.annotation.ABLine2D(slope, intercept, *args, **kwargs)[source]#
Bases:
Line2DDraw a line based on its slope and y-intercept. Additional arguments are passed to the <matplotlib.lines.Line2D> constructor.
- add_callback(func)[source]#
Add a callback function that will be called whenever one of the .Artist’s properties changes.
Parameters#
- funccallable
The callback function. It must have the signature:
def func(artist: Artist) -> Any
where artist is the calling .Artist. Return values may exist but are ignored.
Returns#
- int
The observer id associated with the callback. This id can be used for removing the callback with .remove_callback later.
See Also#
remove_callback
- property axes#
The ~.axes.Axes instance the artist resides in, or None.
- contains(mouseevent)[source]#
Test whether mouseevent occurred on the line.
An event is deemed to have occurred “on” the line if it is less than
self.pickradius(default: 5 points) away from it. Use ~.Line2D.get_pickradius or ~.Line2D.set_pickradius to get or set the pick radius.Parameters#
mouseevent : ~matplotlib.backend_bases.MouseEvent
Returns#
- containsbool
Whether any values are within the radius.
- detailsdict
A dictionary
{'ind': pointlist}, where pointlist is a list of points of the line that are within the pickradius around the event position.TODO: sort returned indices by distance
- convert_xunits(x)[source]#
Convert x using the unit type of the xaxis.
If the artist is not contained in an Axes or if the xaxis does not have units, x itself is returned.
- convert_yunits(y)[source]#
Convert y using the unit type of the yaxis.
If the artist is not contained in an Axes or if the yaxis does not have units, y itself is returned.
- draw(renderer)[source]#
Draw the Artist (and its children) using the given renderer.
This has no effect if the artist is not visible (.Artist.get_visible returns False).
Parameters#
renderer : ~matplotlib.backend_bases.RendererBase subclass.
Notes#
This method is overridden in the Artist subclasses.
- findobj(match=None, include_self=True)[source]#
Find artist objects.
Recursively find all .Artist instances contained in the artist.
Parameters#
- match
A filter criterion for the matches. This can be
None: Return all objects contained in artist.
A function with signature
def match(artist: Artist) -> bool. The result will only contain artists for which the function returns True.A class instance: e.g., .Line2D. The result will only contain artists of this class or its subclasses (
isinstancecheck).
- include_selfbool
Include self in the list to be checked for a match.
Returns#
list of .Artist
- format_cursor_data(data)[source]#
Return a string representation of data.
Note
This method is intended to be overridden by artist subclasses. As an end-user of Matplotlib you will most likely not call this method yourself.
The default implementation converts ints and floats and arrays of ints and floats into a comma-separated string enclosed in square brackets, unless the artist has an associated colorbar, in which case scalar values are formatted using the colorbar’s formatter.
See Also#
get_cursor_data
- get_cursor_data(event)[source]#
Return the cursor data for a given event.
Note
This method is intended to be overridden by artist subclasses. As an end-user of Matplotlib you will most likely not call this method yourself.
Cursor data can be used by Artists to provide additional context information for a given event. The default implementation just returns None.
Subclasses can override the method and return arbitrary data. However, when doing so, they must ensure that .format_cursor_data can convert the data to a string representation.
The only current use case is displaying the z-value of an .AxesImage in the status bar of a plot window, while moving the mouse.
Parameters#
event : ~matplotlib.backend_bases.MouseEvent
See Also#
format_cursor_data
- get_dash_capstyle()[source]#
Return the .CapStyle for dashed lines.
See also ~.Line2D.set_dash_capstyle.
- get_dash_joinstyle()[source]#
Return the .JoinStyle for dashed lines.
See also ~.Line2D.set_dash_joinstyle.
- get_data(orig=True)[source]#
Return the line data as an
(xdata, ydata)pair.If orig is True, return the original data.
- get_in_layout()[source]#
Return boolean flag,
Trueif artist is included in layout calculations.E.g. constrainedlayout_guide, .Figure.tight_layout(), and
fig.savefig(fname, bbox_inches='tight').
- get_markeredgewidth()[source]#
Return the marker edge width in points.
See also ~.Line2D.set_markeredgewidth.
- get_markerfacecoloralt()[source]#
Return the alternate marker face color.
See also ~.Line2D.set_markerfacecoloralt.
- get_markevery()[source]#
Return the markevery setting for marker subsampling.
See also ~.Line2D.set_markevery.
- get_mouseover()[source]#
Return whether this artist is queried for custom context information when the mouse cursor moves over it.
- get_picker()[source]#
Return the picking behavior of the artist.
The possible values are described in .set_picker.
See Also#
set_picker, pickable, pick
- get_pickradius()[source]#
Return the pick radius used for containment tests.
See .contains for more details.
- get_sketch_params()[source]#
Return the sketch parameters for the artist.
Returns#
tuple or None
A 3-tuple with the following elements:
scale: The amplitude of the wiggle perpendicular to the source line.
length: The length of the wiggle along the line.
randomness: The scale factor by which the length is shrunken or expanded.
Returns None if no sketch parameters were set.
- get_solid_capstyle()[source]#
Return the .CapStyle for solid lines.
See also ~.Line2D.set_solid_capstyle.
- get_solid_joinstyle()[source]#
Return the .JoinStyle for solid lines.
See also ~.Line2D.set_solid_joinstyle.
- get_tightbbox(renderer=None)[source]#
Like .Artist.get_window_extent, but includes any clipping.
Parameters#
- renderer~matplotlib.backend_bases.RendererBase subclass, optional
renderer that will be used to draw the figures (i.e.
fig.canvas.get_renderer())
Returns#
- .Bbox or None
The enclosing bounding box (in figure pixel coordinates). Returns None if clipping results in no intersection.
- get_transformed_clip_path_and_affine()[source]#
Return the clip path with the non-affine part of its transformation applied, and the remaining affine part of its transformation.
- get_window_extent(renderer=None)[source]#
Get the artist’s bounding box in display space.
The bounding box’ width and height are nonnegative.
Subclasses should override for inclusion in the bounding box “tight” calculation. Default is to return an empty bounding box at 0, 0.
Be careful when using this function, the results will not update if the artist window extent of the artist changes. The extent can change due to any changes in the transform stack, such as changing the axes limits, the figure size, or the canvas used (as is done when saving a figure). This can lead to unexpected behavior where interactive figures will look fine on the screen, but will save incorrectly.
- get_xdata(orig=True)[source]#
Return the xdata.
If orig is True, return the original data, else the processed data.
- get_ydata(orig=True)[source]#
Return the ydata.
If orig is True, return the original data, else the processed data.
- is_dashed()[source]#
Return whether line has a dashed linestyle.
A custom linestyle is assumed to be dashed, we do not inspect the
onoffseqdirectly.See also ~.Line2D.set_linestyle.
- is_transform_set()[source]#
Return whether the Artist has an explicitly set transform.
This is True after .set_transform has been called.
- property mouseover#
Return whether this artist is queried for custom context information when the mouse cursor moves over it.
- pchanged()[source]#
Call all of the registered callbacks.
This function is triggered internally when a property is changed.
See Also#
add_callback remove_callback
- pick(mouseevent)[source]#
Process a pick event.
Each child artist will fire a pick event if mouseevent is over the artist and the artist has picker set.
See Also#
set_picker, get_picker, pickable
- property pickradius#
Return the pick radius used for containment tests.
See .contains for more details.
- remove()[source]#
Remove the artist from the figure if possible.
The effect will not be visible until the figure is redrawn, e.g., with .FigureCanvasBase.draw_idle. Call ~.axes.Axes.relim to update the axes limits if desired.
Note: ~.axes.Axes.relim will not see collections even if the collection was added to the axes with autolim = True.
Note: there is no support for removing the artist’s legend entry.
- set(*, agg_filter=<UNSET>, alpha=<UNSET>, animated=<UNSET>, antialiased=<UNSET>, clip_box=<UNSET>, clip_on=<UNSET>, clip_path=<UNSET>, color=<UNSET>, dash_capstyle=<UNSET>, dash_joinstyle=<UNSET>, dashes=<UNSET>, data=<UNSET>, drawstyle=<UNSET>, fillstyle=<UNSET>, gapcolor=<UNSET>, gid=<UNSET>, in_layout=<UNSET>, label=<UNSET>, linestyle=<UNSET>, linewidth=<UNSET>, marker=<UNSET>, markeredgecolor=<UNSET>, markeredgewidth=<UNSET>, markerfacecolor=<UNSET>, markerfacecoloralt=<UNSET>, markersize=<UNSET>, markevery=<UNSET>, mouseover=<UNSET>, path_effects=<UNSET>, picker=<UNSET>, pickradius=<UNSET>, rasterized=<UNSET>, sketch_params=<UNSET>, snap=<UNSET>, solid_capstyle=<UNSET>, solid_joinstyle=<UNSET>, transform=<UNSET>, url=<UNSET>, visible=<UNSET>, xdata=<UNSET>, ydata=<UNSET>, zorder=<UNSET>)[source]#
Set multiple properties at once.
Supported properties are
- Properties:
agg_filter: a filter function, which takes a (m, n, 3) float array and a dpi value, and returns a (m, n, 3) array and two offsets from the bottom left corner of the image alpha: scalar or None animated: bool antialiased or aa: bool clip_box: ~matplotlib.transforms.BboxBase or None clip_on: bool clip_path: Patch or (Path, Transform) or None color or c: color dash_capstyle: .CapStyle or {‘butt’, ‘projecting’, ‘round’} dash_joinstyle: .JoinStyle or {‘miter’, ‘round’, ‘bevel’} dashes: sequence of floats (on/off ink in points) or (None, None) data: (2, N) array or two 1D arrays drawstyle or ds: {‘default’, ‘steps’, ‘steps-pre’, ‘steps-mid’, ‘steps-post’}, default: ‘default’ figure: ~matplotlib.figure.Figure fillstyle: {‘full’, ‘left’, ‘right’, ‘bottom’, ‘top’, ‘none’} gapcolor: color or None gid: str in_layout: bool label: object linestyle or ls: {‘-’, ‘–’, ‘-.’, ‘:’, ‘’, (offset, on-off-seq), …} linewidth or lw: float marker: marker style string, ~.path.Path or ~.markers.MarkerStyle markeredgecolor or mec: color markeredgewidth or mew: float markerfacecolor or mfc: color markerfacecoloralt or mfcalt: color markersize or ms: float markevery: None or int or (int, int) or slice or list[int] or float or (float, float) or list[bool] mouseover: bool path_effects: list of .AbstractPathEffect picker: float or callable[[Artist, Event], tuple[bool, dict]] pickradius: float rasterized: bool sketch_params: (scale: float, length: float, randomness: float) snap: bool or None solid_capstyle: .CapStyle or {‘butt’, ‘projecting’, ‘round’} solid_joinstyle: .JoinStyle or {‘miter’, ‘round’, ‘bevel’} transform: ~matplotlib.transforms.Transform url: str visible: bool xdata: 1D array ydata: 1D array zorder: float
- set_agg_filter(filter_func)[source]#
Set the agg filter.
Parameters#
- filter_funccallable
A filter function, which takes a (m, n, depth) float array and a dpi value, and returns a (m, n, depth) array and two offsets from the bottom left corner of the image
- set_alpha(alpha)[source]#
Set the alpha value used for blending - not supported on all backends.
Parameters#
- alphascalar or None
alpha must be within the 0-1 range, inclusive.
- set_animated(b)[source]#
Set whether the artist is intended to be used in an animation.
If True, the artist is excluded from regular drawing of the figure. You have to call .Figure.draw_artist / .Axes.draw_artist explicitly on the artist. This approach is used to speed up animations using blitting.
See also matplotlib.animation and blitting.
Parameters#
b : bool
- set_clip_box(clipbox)[source]#
Set the artist’s clip .Bbox.
Parameters#
- clipbox~matplotlib.transforms.BboxBase or None
Will typically be created from a .TransformedBbox. For instance,
TransformedBbox(Bbox([[0, 0], [1, 1]]), ax.transAxes)is the default clipping for an artist added to an Axes.
- set_clip_on(b)[source]#
Set whether the artist uses clipping.
When False, artists will be visible outside the Axes which can lead to unexpected results.
Parameters#
b : bool
- set_clip_path(path, transform=None)[source]#
Set the artist’s clip path.
Parameters#
- path~matplotlib.patches.Patch or .Path or .TransformedPath or None
The clip path. If given a .Path, transform must be provided as well. If None, a previously set clip path is removed.
- transform~matplotlib.transforms.Transform, optional
Only used if path is a .Path, in which case the given .Path is converted to a .TransformedPath using transform.
Notes#
For efficiency, if path is a .Rectangle this method will set the clipping box to the corresponding rectangle and set the clipping path to
None.For technical reasons (support of ~.Artist.set), a tuple (path, transform) is also accepted as a single positional parameter.
- set_dash_capstyle(s)[source]#
How to draw the end caps if the line is ~Line2D.is_dashed.
The default capstyle is :rc:`lines.dash_capstyle`.
Parameters#
s : .CapStyle or {‘butt’, ‘projecting’, ‘round’}
- set_dash_joinstyle(s)[source]#
How to join segments of the line if it ~Line2D.is_dashed.
The default joinstyle is :rc:`lines.dash_joinstyle`.
Parameters#
s : .JoinStyle or {‘miter’, ‘round’, ‘bevel’}
- set_dashes(seq)[source]#
Set the dash sequence.
The dash sequence is a sequence of floats of even length describing the length of dashes and spaces in points.
For example, (5, 2, 1, 2) describes a sequence of 5 point and 1 point dashes separated by 2 point spaces.
See also ~.Line2D.set_gapcolor, which allows those spaces to be filled with a color.
Parameters#
- seqsequence of floats (on/off ink in points) or (None, None)
If seq is empty or
(None, None), the linestyle will be set to solid.
- set_drawstyle(drawstyle)[source]#
Set the drawstyle of the plot.
The drawstyle determines how the points are connected.
Parameters#
- drawstyle{‘default’, ‘steps’, ‘steps-pre’, ‘steps-mid’, ‘steps-post’}, default: ‘default’
For ‘default’, the points are connected with straight lines.
The steps variants connect the points with step-like lines, i.e. horizontal lines with vertical steps. They differ in the location of the step:
‘steps-pre’: The step is at the beginning of the line segment, i.e. the line will be at the y-value of point to the right.
‘steps-mid’: The step is halfway between the points.
‘steps-post: The step is at the end of the line segment, i.e. the line will be at the y-value of the point to the left.
‘steps’ is equal to ‘steps-pre’ and is maintained for backward-compatibility.
For examples see /gallery/lines_bars_and_markers/step_demo.
- set_figure(fig)[source]#
Set the .Figure instance the artist belongs to.
Parameters#
fig : ~matplotlib.figure.Figure
- set_fillstyle(fs)[source]#
Set the marker fill style.
Parameters#
- fs{‘full’, ‘left’, ‘right’, ‘bottom’, ‘top’, ‘none’}
Possible values:
‘full’: Fill the whole marker with the markerfacecolor.
‘left’, ‘right’, ‘bottom’, ‘top’: Fill the marker half at the given side with the markerfacecolor. The other half of the marker is filled with markerfacecoloralt.
‘none’: No filling.
For examples see marker_fill_styles.
- set_gapcolor(gapcolor)[source]#
Set a color to fill the gaps in the dashed line style.
Note
Striped lines are created by drawing two interleaved dashed lines. There can be overlaps between those two, which may result in artifacts when using transparency.
This functionality is experimental and may change.
Parameters#
- gapcolorcolor or None
The color with which to fill the gaps. If None, the gaps are unfilled.
- set_in_layout(in_layout)[source]#
Set if artist is to be included in layout calculations, E.g. constrainedlayout_guide, .Figure.tight_layout(), and
fig.savefig(fname, bbox_inches='tight').Parameters#
in_layout : bool
- set_label(s)[source]#
Set a label that will be displayed in the legend.
Parameters#
- sobject
s will be converted to a string by calling str.
- set_linestyle(ls)[source]#
Set the linestyle of the line.
Parameters#
- ls{‘-’, ‘–’, ‘-.’, ‘:’, ‘’, (offset, on-off-seq), …}
Possible values:
A string:
linestyle
description
'-'or'solid'solid line
'--'or'dashed'dashed line
'-.'or'dashdot'dash-dotted line
':'or'dotted'dotted line
'none','None',' ', or''draw nothing
Alternatively a dash tuple of the following form can be provided:
(offset, onoffseq)
where
onoffseqis an even length tuple of on and off ink in points. See alsoset_dashes().
For examples see /gallery/lines_bars_and_markers/linestyles.
- set_marker(marker)[source]#
Set the line marker.
Parameters#
- markermarker style string, ~.path.Path or ~.markers.MarkerStyle
See ~matplotlib.markers for full description of possible arguments.
- set_markeredgewidth(ew)[source]#
Set the marker edge width in points.
Parameters#
- ewfloat
Marker edge width, in points.
- set_markersize(sz)[source]#
Set the marker size in points.
Parameters#
- szfloat
Marker size, in points.
- set_markevery(every)[source]#
Set the markevery property to subsample the plot when using markers.
e.g., if
every=5, every 5-th marker will be plotted.Parameters#
- everyNone or int or (int, int) or slice or list[int] or float or (float, float) or list[bool]
Which markers to plot.
every=None: every point will be plotted.every=N: every N-th marker will be plotted starting with marker 0.every=(start, N): every N-th marker, starting at index start, will be plotted.every=slice(start, end, N): every N-th marker, starting at index start, up to but not including index end, will be plotted.every=[i, j, m, ...]: only markers at the given indices will be plotted.every=[True, False, True, ...]: only positions that are True will be plotted. The list must have the same length as the data points.every=0.1, (i.e. a float): markers will be spaced at approximately equal visual distances along the line; the distance along the line between markers is determined by multiplying the display-coordinate distance of the axes bounding-box diagonal by the value of every.every=(0.5, 0.1)(i.e. a length-2 tuple of float): similar toevery=0.1but the first marker will be offset along the line by 0.5 multiplied by the display-coordinate-diagonal-distance along the line.
For examples see /gallery/lines_bars_and_markers/markevery_demo.
Notes#
Setting markevery will still only draw markers at actual data points. While the float argument form aims for uniform visual spacing, it has to coerce from the ideal spacing to the nearest available data point. Depending on the number and distribution of data points, the result may still not look evenly spaced.
When using a start offset to specify the first marker, the offset will be from the first data point which may be different from the first the visible data point if the plot is zoomed in.
If zooming in on a plot when using float arguments then the actual data points that have markers will change because the distance between markers is always determined from the display-coordinates axes-bounding-box-diagonal regardless of the actual axes data limits.
- set_mouseover(mouseover)[source]#
Set whether this artist is queried for custom context information when the mouse cursor moves over it.
Parameters#
mouseover : bool
See Also#
get_cursor_data .ToolCursorPosition .NavigationToolbar2
- set_path_effects(path_effects)[source]#
Set the path effects.
Parameters#
path_effects : list of .AbstractPathEffect
- set_picker(p)[source]#
Set the event picker details for the line.
Parameters#
- pfloat or callable[[Artist, Event], tuple[bool, dict]]
If a float, it is used as the pick radius in points.
- set_pickradius(pickradius)[source]#
Set the pick radius used for containment tests.
See .contains for more details.
Parameters#
- pickradiusfloat
Pick radius, in points.
- set_rasterized(rasterized)[source]#
Force rasterized (bitmap) drawing for vector graphics output.
Rasterized drawing is not supported by all artists. If you try to enable this on an artist that does not support it, the command has no effect and a warning will be issued.
This setting is ignored for pixel-based output.
See also /gallery/misc/rasterization_demo.
Parameters#
rasterized : bool
- set_sketch_params(scale=None, length=None, randomness=None)[source]#
Set the sketch parameters.
Parameters#
- scalefloat, optional
The amplitude of the wiggle perpendicular to the source line, in pixels. If scale is None, or not provided, no sketch filter will be provided.
- lengthfloat, optional
The length of the wiggle along the line, in pixels (default 128.0)
- randomnessfloat, optional
The scale factor by which the length is shrunken or expanded (default 16.0)
The PGF backend uses this argument as an RNG seed and not as described above. Using the same seed yields the same random shape.
- set_snap(snap)[source]#
Set the snapping behavior.
Snapping aligns positions with the pixel grid, which results in clearer images. For example, if a black line of 1px width was defined at a position in between two pixels, the resulting image would contain the interpolated value of that line in the pixel grid, which would be a grey value on both adjacent pixel positions. In contrast, snapping will move the line to the nearest integer pixel value, so that the resulting image will really contain a 1px wide black line.
Snapping is currently only supported by the Agg and MacOSX backends.
Parameters#
- snapbool or None
Possible values:
True: Snap vertices to the nearest pixel center.
False: Do not modify vertex positions.
None: (auto) If the path contains only rectilinear line segments, round to the nearest pixel center.
- set_solid_capstyle(s)[source]#
How to draw the end caps if the line is solid (not ~Line2D.is_dashed)
The default capstyle is :rc:`lines.solid_capstyle`.
Parameters#
s : .CapStyle or {‘butt’, ‘projecting’, ‘round’}
- set_solid_joinstyle(s)[source]#
How to join segments if the line is solid (not ~Line2D.is_dashed).
The default joinstyle is :rc:`lines.solid_joinstyle`.
Parameters#
s : .JoinStyle or {‘miter’, ‘round’, ‘bevel’}
- set_transform(t)[source]#
Set the artist transform.
Parameters#
t : ~matplotlib.transforms.Transform
- set_zorder(level)[source]#
Set the zorder for the artist. Artists with lower zorder values are drawn first.
Parameters#
level : float
- property stale#
Whether the artist is ‘stale’ and needs to be re-drawn for the output to match the internal state of the artist.
- property sticky_edges#
xandysticky edge lists for autoscaling.When performing autoscaling, if a data limit coincides with a value in the corresponding sticky_edges list, then no margin will be added–the view limit “sticks” to the edge. A typical use case is histograms, where one usually expects no margin on the bottom edge (0) of the histogram.
Moreover, margin expansion “bumps” against sticky edges and cannot cross them. For example, if the upper data limit is 1.0, the upper view limit computed by simple margin application is 1.2, but there is a sticky edge at 1.1, then the actual upper view limit will be 1.1.
This attribute cannot be assigned to; however, the
xandylists can be modified in place as needed.Examples#
>>> artist.sticky_edges.x[:] = (xmin, xmax)
>>> artist.sticky_edges.y[:] = (ymin, ymax)
- class holoviews.plotting.mpl.annotation.AnnotationPlot(annotation, **params)[source]#
Bases:
ElementPlotAnnotationPlot handles the display of all annotation elements.
Parameters inherited from:
holoviews.plotting.plot.DimensionedPlot: fontsize, fontscale, show_title, title, normalizeholoviews.plotting.mpl.plot.MPLPlot: projection, backend_opts, fig_alpha, fig_bounds, fig_inches, fig_latex, fig_rcparams, fig_size, initial_hooks, sublabel_format, sublabel_position, sublabel_size, show_frameholoviews.plotting.plot.GenericElementPlot: apply_ranges, apply_extents, bgcolor, default_span, hooks, invert_axes, invert_xaxis, invert_yaxis, logx, logy, padding, show_grid, xaxis, yaxis, xlabel, ylabel, xlim, ylim, zlim, xrotation, yrotation, xticks, yticksholoviews.plotting.mpl.element.ElementPlot: apply_ticks, aspect, data_aspect, invert_zaxis, labelled, logz, xformatter, yformatter, zformatter, zaxis, zlabel, zrotation, zticksshow_legend= param.Boolean(allow_refs=False, default=False, label=’Show legend’, nested_refs=False, rx=<param.reactive.reactive_ops object at 0x7f6aeed2cb10>)Whether to show legend for the plot.
- anim(start=0, stop=None, fps=30)[source]#
Method to return a matplotlib animation. The start and stop frames may be specified as well as the fps.
- compute_ranges(obj, key, ranges)[source]#
Given an object, a specific key, and the normalization options, this method will find the specified normalization options on the appropriate OptionTree, group the elements according to the selected normalization option (i.e. either per frame or over the whole animation) and finally compute the dimension ranges in each group. The new set of ranges is returned.
- get_extents(element, ranges, range_type='combined', dimension=None, xdim=None, ydim=None, zdim=None, lims_as_soft_ranges=False, **kwargs)[source]#
Gets the extents for the axes from the current Element. The globally computed ranges can optionally override the extents.
The extents are computed by combining the data ranges, extents and dimension ranges. Each of these can be obtained individually by setting the range_type to one of:
‘data’: Just the data ranges
‘extents’: Element.extents
‘soft’: Dimension.soft_range values
‘hard’: Dimension.range values
To obtain the combined range, which includes range padding the default may be used:
‘combined’: All the range types combined and padding applied
This allows Overlay plots to obtain each range and combine them appropriately for all the objects in the overlay.
If lims_as_soft_ranges is set to True, the xlim and ylim will be treated as soft ranges instead of the default case as hard ranges while computing the extents. This is used e.g. when apply_hard_bounds is True and xlim/ylim is set, in which case we limit the initial viewable range to xlim/ylim, but allow navigation up to the abs max between the data range and xlim/ylim.
- get_padding(obj, extents)[source]#
Computes padding along the axes taking into account the plot aspect.
- get_zorder(overlay, key, el)[source]#
Computes the z-order of element in the NdOverlay taking into account possible batching of elements.
- init_artists(ax, plot_args, plot_kwargs)[source]#
Initializes the artist based on the plot method declared on the plot.
- refresh(**kwargs)[source]#
Refreshes the plot by rerendering it and then pushing the updated data if the plot has an associated Comm.
- property state#
The plotting state that gets updated via the update method and used by the renderer to generate output.
- teardown_handles()[source]#
If no custom update_handles method is supplied this method is called to tear down any previous handles before replacing them.
- traverse(fn=None, specs=None, full_breadth=True)[source]#
Traverses any nested DimensionedPlot returning a list of all plots that match the specs. The specs should be supplied as a list of either Plot types or callables, which should return a boolean given the plot class.
- update(key)[source]#
Update the internal state of the Plot to represent the given key tuple (where integers represent frames). Returns this state.
- class holoviews.plotting.mpl.annotation.ArrowPlot(annotation, **params)[source]#
Bases:
AnnotationPlotDraw an arrow using the information supplied to the Arrow annotation
Parameters inherited from:
holoviews.plotting.plot.DimensionedPlot: fontsize, fontscale, show_title, title, normalizeholoviews.plotting.mpl.plot.MPLPlot: projection, backend_opts, fig_alpha, fig_bounds, fig_inches, fig_latex, fig_rcparams, fig_size, initial_hooks, sublabel_format, sublabel_position, sublabel_size, show_frameholoviews.plotting.plot.GenericElementPlot: apply_ranges, apply_extents, bgcolor, default_span, hooks, invert_axes, invert_xaxis, invert_yaxis, logx, logy, padding, show_grid, xaxis, yaxis, xlabel, ylabel, xlim, ylim, zlim, xrotation, yrotation, xticks, yticksholoviews.plotting.mpl.element.ElementPlot: apply_ticks, aspect, data_aspect, invert_zaxis, labelled, logz, xformatter, yformatter, zformatter, zaxis, zlabel, zrotation, zticksholoviews.plotting.mpl.annotation.AnnotationPlot: show_legend- anim(start=0, stop=None, fps=30)[source]#
Method to return a matplotlib animation. The start and stop frames may be specified as well as the fps.
- compute_ranges(obj, key, ranges)[source]#
Given an object, a specific key, and the normalization options, this method will find the specified normalization options on the appropriate OptionTree, group the elements according to the selected normalization option (i.e. either per frame or over the whole animation) and finally compute the dimension ranges in each group. The new set of ranges is returned.
- get_extents(element, ranges, range_type='combined', dimension=None, xdim=None, ydim=None, zdim=None, lims_as_soft_ranges=False, **kwargs)[source]#
Gets the extents for the axes from the current Element. The globally computed ranges can optionally override the extents.
The extents are computed by combining the data ranges, extents and dimension ranges. Each of these can be obtained individually by setting the range_type to one of:
‘data’: Just the data ranges
‘extents’: Element.extents
‘soft’: Dimension.soft_range values
‘hard’: Dimension.range values
To obtain the combined range, which includes range padding the default may be used:
‘combined’: All the range types combined and padding applied
This allows Overlay plots to obtain each range and combine them appropriately for all the objects in the overlay.
If lims_as_soft_ranges is set to True, the xlim and ylim will be treated as soft ranges instead of the default case as hard ranges while computing the extents. This is used e.g. when apply_hard_bounds is True and xlim/ylim is set, in which case we limit the initial viewable range to xlim/ylim, but allow navigation up to the abs max between the data range and xlim/ylim.
- get_padding(obj, extents)[source]#
Computes padding along the axes taking into account the plot aspect.
- get_zorder(overlay, key, el)[source]#
Computes the z-order of element in the NdOverlay taking into account possible batching of elements.
- init_artists(ax, plot_args, plot_kwargs)[source]#
Initializes the artist based on the plot method declared on the plot.
- refresh(**kwargs)[source]#
Refreshes the plot by rerendering it and then pushing the updated data if the plot has an associated Comm.
- property state#
The plotting state that gets updated via the update method and used by the renderer to generate output.
- teardown_handles()[source]#
If no custom update_handles method is supplied this method is called to tear down any previous handles before replacing them.
- traverse(fn=None, specs=None, full_breadth=True)[source]#
Traverses any nested DimensionedPlot returning a list of all plots that match the specs. The specs should be supplied as a list of either Plot types or callables, which should return a boolean given the plot class.
- update(key)[source]#
Update the internal state of the Plot to represent the given key tuple (where integers represent frames). Returns this state.
- class holoviews.plotting.mpl.annotation.HLinePlot(annotation, **params)[source]#
Bases:
AnnotationPlotDraw a horizontal line on the axis
Parameters inherited from:
holoviews.plotting.plot.DimensionedPlot: fontsize, fontscale, show_title, title, normalizeholoviews.plotting.mpl.plot.MPLPlot: projection, backend_opts, fig_alpha, fig_bounds, fig_inches, fig_latex, fig_rcparams, fig_size, initial_hooks, sublabel_format, sublabel_position, sublabel_size, show_frameholoviews.plotting.plot.GenericElementPlot: apply_ranges, apply_extents, bgcolor, default_span, hooks, invert_axes, invert_xaxis, invert_yaxis, logx, logy, padding, show_grid, xaxis, yaxis, xlabel, ylabel, xlim, ylim, zlim, xrotation, yrotation, xticks, yticksholoviews.plotting.mpl.element.ElementPlot: apply_ticks, aspect, data_aspect, invert_zaxis, labelled, logz, xformatter, yformatter, zformatter, zaxis, zlabel, zrotation, zticksholoviews.plotting.mpl.annotation.AnnotationPlot: show_legend- anim(start=0, stop=None, fps=30)[source]#
Method to return a matplotlib animation. The start and stop frames may be specified as well as the fps.
- compute_ranges(obj, key, ranges)[source]#
Given an object, a specific key, and the normalization options, this method will find the specified normalization options on the appropriate OptionTree, group the elements according to the selected normalization option (i.e. either per frame or over the whole animation) and finally compute the dimension ranges in each group. The new set of ranges is returned.
- get_extents(element, ranges, range_type='combined', dimension=None, xdim=None, ydim=None, zdim=None, lims_as_soft_ranges=False, **kwargs)[source]#
Gets the extents for the axes from the current Element. The globally computed ranges can optionally override the extents.
The extents are computed by combining the data ranges, extents and dimension ranges. Each of these can be obtained individually by setting the range_type to one of:
‘data’: Just the data ranges
‘extents’: Element.extents
‘soft’: Dimension.soft_range values
‘hard’: Dimension.range values
To obtain the combined range, which includes range padding the default may be used:
‘combined’: All the range types combined and padding applied
This allows Overlay plots to obtain each range and combine them appropriately for all the objects in the overlay.
If lims_as_soft_ranges is set to True, the xlim and ylim will be treated as soft ranges instead of the default case as hard ranges while computing the extents. This is used e.g. when apply_hard_bounds is True and xlim/ylim is set, in which case we limit the initial viewable range to xlim/ylim, but allow navigation up to the abs max between the data range and xlim/ylim.
- get_padding(obj, extents)[source]#
Computes padding along the axes taking into account the plot aspect.
- get_zorder(overlay, key, el)[source]#
Computes the z-order of element in the NdOverlay taking into account possible batching of elements.
- init_artists(ax, plot_args, plot_kwargs)[source]#
Initializes the artist based on the plot method declared on the plot.
- refresh(**kwargs)[source]#
Refreshes the plot by rerendering it and then pushing the updated data if the plot has an associated Comm.
- property state#
The plotting state that gets updated via the update method and used by the renderer to generate output.
- teardown_handles()[source]#
If no custom update_handles method is supplied this method is called to tear down any previous handles before replacing them.
- traverse(fn=None, specs=None, full_breadth=True)[source]#
Traverses any nested DimensionedPlot returning a list of all plots that match the specs. The specs should be supplied as a list of either Plot types or callables, which should return a boolean given the plot class.
- update(key)[source]#
Update the internal state of the Plot to represent the given key tuple (where integers represent frames). Returns this state.
- class holoviews.plotting.mpl.annotation.HLinesAnnotationPlot(annotation, **params)[source]#
Bases:
_SyntheticAnnotationPlotParameters inherited from:
holoviews.plotting.plot.DimensionedPlot: fontsize, fontscale, show_title, title, normalizeholoviews.plotting.mpl.plot.MPLPlot: projection, backend_opts, fig_alpha, fig_bounds, fig_inches, fig_latex, fig_rcparams, fig_size, initial_hooks, sublabel_format, sublabel_position, sublabel_size, show_frameholoviews.plotting.plot.GenericElementPlot: apply_extents, bgcolor, default_span, hooks, invert_axes, invert_xaxis, invert_yaxis, logx, logy, padding, show_grid, xaxis, yaxis, xlabel, ylabel, xlim, ylim, zlim, xrotation, yrotation, xticks, yticksholoviews.plotting.mpl.element.ElementPlot: apply_ticks, aspect, data_aspect, invert_zaxis, labelled, logz, xformatter, yformatter, zformatter, zaxis, zlabel, zrotation, zticksholoviews.plotting.mpl.annotation.AnnotationPlot: show_legendholoviews.plotting.mpl.annotation._SyntheticAnnotationPlot: apply_ranges- anim(start=0, stop=None, fps=30)[source]#
Method to return a matplotlib animation. The start and stop frames may be specified as well as the fps.
- compute_ranges(obj, key, ranges)[source]#
Given an object, a specific key, and the normalization options, this method will find the specified normalization options on the appropriate OptionTree, group the elements according to the selected normalization option (i.e. either per frame or over the whole animation) and finally compute the dimension ranges in each group. The new set of ranges is returned.
- get_extents(element, ranges=None, range_type='combined', **kwargs)[source]#
Gets the extents for the axes from the current Element. The globally computed ranges can optionally override the extents.
The extents are computed by combining the data ranges, extents and dimension ranges. Each of these can be obtained individually by setting the range_type to one of:
‘data’: Just the data ranges
‘extents’: Element.extents
‘soft’: Dimension.soft_range values
‘hard’: Dimension.range values
To obtain the combined range, which includes range padding the default may be used:
‘combined’: All the range types combined and padding applied
This allows Overlay plots to obtain each range and combine them appropriately for all the objects in the overlay.
If lims_as_soft_ranges is set to True, the xlim and ylim will be treated as soft ranges instead of the default case as hard ranges while computing the extents. This is used e.g. when apply_hard_bounds is True and xlim/ylim is set, in which case we limit the initial viewable range to xlim/ylim, but allow navigation up to the abs max between the data range and xlim/ylim.
- get_padding(obj, extents)[source]#
Computes padding along the axes taking into account the plot aspect.
- get_zorder(overlay, key, el)[source]#
Computes the z-order of element in the NdOverlay taking into account possible batching of elements.
- init_artists(ax, plot_args, plot_kwargs)[source]#
Initializes the artist based on the plot method declared on the plot.
- refresh(**kwargs)[source]#
Refreshes the plot by rerendering it and then pushing the updated data if the plot has an associated Comm.
- property state#
The plotting state that gets updated via the update method and used by the renderer to generate output.
- teardown_handles()[source]#
If no custom update_handles method is supplied this method is called to tear down any previous handles before replacing them.
- traverse(fn=None, specs=None, full_breadth=True)[source]#
Traverses any nested DimensionedPlot returning a list of all plots that match the specs. The specs should be supplied as a list of either Plot types or callables, which should return a boolean given the plot class.
- update(key)[source]#
Update the internal state of the Plot to represent the given key tuple (where integers represent frames). Returns this state.
- class holoviews.plotting.mpl.annotation.HSpanPlot(annotation, **params)[source]#
Bases:
AnnotationPlotDraw a horizontal span on the axis
Parameters inherited from:
holoviews.plotting.plot.DimensionedPlot: fontsize, fontscale, show_title, title, normalizeholoviews.plotting.mpl.plot.MPLPlot: projection, backend_opts, fig_alpha, fig_bounds, fig_inches, fig_latex, fig_rcparams, fig_size, initial_hooks, sublabel_format, sublabel_position, sublabel_size, show_frameholoviews.plotting.plot.GenericElementPlot: apply_ranges, apply_extents, bgcolor, default_span, hooks, invert_axes, invert_xaxis, invert_yaxis, logx, logy, padding, show_grid, xaxis, yaxis, xlabel, ylabel, xlim, ylim, zlim, xrotation, yrotation, xticks, yticksholoviews.plotting.mpl.element.ElementPlot: apply_ticks, aspect, data_aspect, invert_zaxis, labelled, logz, xformatter, yformatter, zformatter, zaxis, zlabel, zrotation, zticksholoviews.plotting.mpl.annotation.AnnotationPlot: show_legend- anim(start=0, stop=None, fps=30)[source]#
Method to return a matplotlib animation. The start and stop frames may be specified as well as the fps.
- compute_ranges(obj, key, ranges)[source]#
Given an object, a specific key, and the normalization options, this method will find the specified normalization options on the appropriate OptionTree, group the elements according to the selected normalization option (i.e. either per frame or over the whole animation) and finally compute the dimension ranges in each group. The new set of ranges is returned.
- get_extents(element, ranges, range_type='combined', dimension=None, xdim=None, ydim=None, zdim=None, lims_as_soft_ranges=False, **kwargs)[source]#
Gets the extents for the axes from the current Element. The globally computed ranges can optionally override the extents.
The extents are computed by combining the data ranges, extents and dimension ranges. Each of these can be obtained individually by setting the range_type to one of:
‘data’: Just the data ranges
‘extents’: Element.extents
‘soft’: Dimension.soft_range values
‘hard’: Dimension.range values
To obtain the combined range, which includes range padding the default may be used:
‘combined’: All the range types combined and padding applied
This allows Overlay plots to obtain each range and combine them appropriately for all the objects in the overlay.
If lims_as_soft_ranges is set to True, the xlim and ylim will be treated as soft ranges instead of the default case as hard ranges while computing the extents. This is used e.g. when apply_hard_bounds is True and xlim/ylim is set, in which case we limit the initial viewable range to xlim/ylim, but allow navigation up to the abs max between the data range and xlim/ylim.
- get_padding(obj, extents)[source]#
Computes padding along the axes taking into account the plot aspect.
- get_zorder(overlay, key, el)[source]#
Computes the z-order of element in the NdOverlay taking into account possible batching of elements.
- init_artists(ax, plot_args, plot_kwargs)[source]#
Initializes the artist based on the plot method declared on the plot.
- refresh(**kwargs)[source]#
Refreshes the plot by rerendering it and then pushing the updated data if the plot has an associated Comm.
- property state#
The plotting state that gets updated via the update method and used by the renderer to generate output.
- teardown_handles()[source]#
If no custom update_handles method is supplied this method is called to tear down any previous handles before replacing them.
- traverse(fn=None, specs=None, full_breadth=True)[source]#
Traverses any nested DimensionedPlot returning a list of all plots that match the specs. The specs should be supplied as a list of either Plot types or callables, which should return a boolean given the plot class.
- update(key)[source]#
Update the internal state of the Plot to represent the given key tuple (where integers represent frames). Returns this state.
- class holoviews.plotting.mpl.annotation.HSpansAnnotationPlot(annotation, **params)[source]#
Bases:
_SyntheticAnnotationPlotParameters inherited from:
holoviews.plotting.plot.DimensionedPlot: fontsize, fontscale, show_title, title, normalizeholoviews.plotting.mpl.plot.MPLPlot: projection, backend_opts, fig_alpha, fig_bounds, fig_inches, fig_latex, fig_rcparams, fig_size, initial_hooks, sublabel_format, sublabel_position, sublabel_size, show_frameholoviews.plotting.plot.GenericElementPlot: apply_extents, bgcolor, default_span, hooks, invert_axes, invert_xaxis, invert_yaxis, logx, logy, padding, show_grid, xaxis, yaxis, xlabel, ylabel, xlim, ylim, zlim, xrotation, yrotation, xticks, yticksholoviews.plotting.mpl.element.ElementPlot: apply_ticks, aspect, data_aspect, invert_zaxis, labelled, logz, xformatter, yformatter, zformatter, zaxis, zlabel, zrotation, zticksholoviews.plotting.mpl.annotation.AnnotationPlot: show_legendholoviews.plotting.mpl.annotation._SyntheticAnnotationPlot: apply_ranges- anim(start=0, stop=None, fps=30)[source]#
Method to return a matplotlib animation. The start and stop frames may be specified as well as the fps.
- compute_ranges(obj, key, ranges)[source]#
Given an object, a specific key, and the normalization options, this method will find the specified normalization options on the appropriate OptionTree, group the elements according to the selected normalization option (i.e. either per frame or over the whole animation) and finally compute the dimension ranges in each group. The new set of ranges is returned.
- get_extents(element, ranges=None, range_type='combined', **kwargs)[source]#
Gets the extents for the axes from the current Element. The globally computed ranges can optionally override the extents.
The extents are computed by combining the data ranges, extents and dimension ranges. Each of these can be obtained individually by setting the range_type to one of:
‘data’: Just the data ranges
‘extents’: Element.extents
‘soft’: Dimension.soft_range values
‘hard’: Dimension.range values
To obtain the combined range, which includes range padding the default may be used:
‘combined’: All the range types combined and padding applied
This allows Overlay plots to obtain each range and combine them appropriately for all the objects in the overlay.
If lims_as_soft_ranges is set to True, the xlim and ylim will be treated as soft ranges instead of the default case as hard ranges while computing the extents. This is used e.g. when apply_hard_bounds is True and xlim/ylim is set, in which case we limit the initial viewable range to xlim/ylim, but allow navigation up to the abs max between the data range and xlim/ylim.
- get_padding(obj, extents)[source]#
Computes padding along the axes taking into account the plot aspect.
- get_zorder(overlay, key, el)[source]#
Computes the z-order of element in the NdOverlay taking into account possible batching of elements.
- init_artists(ax, plot_args, plot_kwargs)[source]#
Initializes the artist based on the plot method declared on the plot.
- refresh(**kwargs)[source]#
Refreshes the plot by rerendering it and then pushing the updated data if the plot has an associated Comm.
- property state#
The plotting state that gets updated via the update method and used by the renderer to generate output.
- teardown_handles()[source]#
If no custom update_handles method is supplied this method is called to tear down any previous handles before replacing them.
- traverse(fn=None, specs=None, full_breadth=True)[source]#
Traverses any nested DimensionedPlot returning a list of all plots that match the specs. The specs should be supplied as a list of either Plot types or callables, which should return a boolean given the plot class.
- update(key)[source]#
Update the internal state of the Plot to represent the given key tuple (where integers represent frames). Returns this state.
- class holoviews.plotting.mpl.annotation.LabelsPlot(*args, **kwargs)[source]#
Bases:
ColorbarPlotParameters inherited from:
holoviews.plotting.plot.DimensionedPlot: fontsize, fontscale, show_title, title, normalizeholoviews.plotting.mpl.plot.MPLPlot: projection, backend_opts, fig_alpha, fig_bounds, fig_inches, fig_latex, fig_rcparams, fig_size, initial_hooks, sublabel_format, sublabel_position, sublabel_size, show_frameholoviews.plotting.plot.GenericElementPlot: apply_ranges, apply_extents, bgcolor, default_span, hooks, invert_axes, invert_xaxis, invert_yaxis, logx, logy, padding, show_legend, show_grid, xaxis, yaxis, xlabel, ylabel, xlim, ylim, zlim, xrotation, yrotation, xticks, yticksholoviews.plotting.mpl.element.ElementPlot: apply_ticks, aspect, data_aspect, invert_zaxis, labelled, logz, xformatter, yformatter, zformatter, zaxis, zlabel, zrotation, zticksholoviews.plotting.mpl.element.ColorbarPlot: clabel, clim, clim_percentile, cformatter, colorbar, colorbar_opts, color_levels, cnorm, clipping_colors, cbar_padding, cbar_ticks, cbar_width, cbar_extend, rescale_discrete_levels, symmetriccolor_index= param.ClassSelector(allow_None=True, allow_refs=False, class_=(<class ‘str’>, <class ‘int’>), label=’Color index’, nested_refs=False, rx=<param.reactive.reactive_ops object at 0x7f6aeed0f0d0>)Index of the dimension from which the color will the drawn
xoffset= param.Number(allow_None=True, allow_refs=False, inclusive_bounds=(True, True), label=’Xoffset’, nested_refs=False, rx=<param.reactive.reactive_ops object at 0x7f6aeed0dc90>)Amount of offset to apply to labels along x-axis.
yoffset= param.Number(allow_None=True, allow_refs=False, inclusive_bounds=(True, True), label=’Yoffset’, nested_refs=False, rx=<param.reactive.reactive_ops object at 0x7f6aeed0c790>)Amount of offset to apply to labels along x-axis.
- anim(start=0, stop=None, fps=30)[source]#
Method to return a matplotlib animation. The start and stop frames may be specified as well as the fps.
- compute_ranges(obj, key, ranges)[source]#
Given an object, a specific key, and the normalization options, this method will find the specified normalization options on the appropriate OptionTree, group the elements according to the selected normalization option (i.e. either per frame or over the whole animation) and finally compute the dimension ranges in each group. The new set of ranges is returned.
- get_extents(element, ranges, range_type='combined', dimension=None, xdim=None, ydim=None, zdim=None, lims_as_soft_ranges=False, **kwargs)[source]#
Gets the extents for the axes from the current Element. The globally computed ranges can optionally override the extents.
The extents are computed by combining the data ranges, extents and dimension ranges. Each of these can be obtained individually by setting the range_type to one of:
‘data’: Just the data ranges
‘extents’: Element.extents
‘soft’: Dimension.soft_range values
‘hard’: Dimension.range values
To obtain the combined range, which includes range padding the default may be used:
‘combined’: All the range types combined and padding applied
This allows Overlay plots to obtain each range and combine them appropriately for all the objects in the overlay.
If lims_as_soft_ranges is set to True, the xlim and ylim will be treated as soft ranges instead of the default case as hard ranges while computing the extents. This is used e.g. when apply_hard_bounds is True and xlim/ylim is set, in which case we limit the initial viewable range to xlim/ylim, but allow navigation up to the abs max between the data range and xlim/ylim.
- get_padding(obj, extents)[source]#
Computes padding along the axes taking into account the plot aspect.
- get_zorder(overlay, key, el)[source]#
Computes the z-order of element in the NdOverlay taking into account possible batching of elements.
- init_artists(ax, plot_args, plot_kwargs)[source]#
Initializes the artist based on the plot method declared on the plot.
- refresh(**kwargs)[source]#
Refreshes the plot by rerendering it and then pushing the updated data if the plot has an associated Comm.
- property state#
The plotting state that gets updated via the update method and used by the renderer to generate output.
- teardown_handles()[source]#
If no custom update_handles method is supplied this method is called to tear down any previous handles before replacing them.
- traverse(fn=None, specs=None, full_breadth=True)[source]#
Traverses any nested DimensionedPlot returning a list of all plots that match the specs. The specs should be supplied as a list of either Plot types or callables, which should return a boolean given the plot class.
- update(key)[source]#
Update the internal state of the Plot to represent the given key tuple (where integers represent frames). Returns this state.
- class holoviews.plotting.mpl.annotation.SlopePlot(annotation, **params)[source]#
Bases:
AnnotationPlotParameters inherited from:
holoviews.plotting.plot.DimensionedPlot: fontsize, fontscale, show_title, title, normalizeholoviews.plotting.mpl.plot.MPLPlot: projection, backend_opts, fig_alpha, fig_bounds, fig_inches, fig_latex, fig_rcparams, fig_size, initial_hooks, sublabel_format, sublabel_position, sublabel_size, show_frameholoviews.plotting.plot.GenericElementPlot: apply_ranges, apply_extents, bgcolor, default_span, hooks, invert_axes, invert_xaxis, invert_yaxis, logx, logy, padding, show_grid, xaxis, yaxis, xlabel, ylabel, xlim, ylim, zlim, xrotation, yrotation, xticks, yticksholoviews.plotting.mpl.element.ElementPlot: apply_ticks, aspect, data_aspect, invert_zaxis, labelled, logz, xformatter, yformatter, zformatter, zaxis, zlabel, zrotation, zticksholoviews.plotting.mpl.annotation.AnnotationPlot: show_legend- anim(start=0, stop=None, fps=30)[source]#
Method to return a matplotlib animation. The start and stop frames may be specified as well as the fps.
- compute_ranges(obj, key, ranges)[source]#
Given an object, a specific key, and the normalization options, this method will find the specified normalization options on the appropriate OptionTree, group the elements according to the selected normalization option (i.e. either per frame or over the whole animation) and finally compute the dimension ranges in each group. The new set of ranges is returned.
- get_extents(element, ranges, range_type='combined', dimension=None, xdim=None, ydim=None, zdim=None, lims_as_soft_ranges=False, **kwargs)[source]#
Gets the extents for the axes from the current Element. The globally computed ranges can optionally override the extents.
The extents are computed by combining the data ranges, extents and dimension ranges. Each of these can be obtained individually by setting the range_type to one of:
‘data’: Just the data ranges
‘extents’: Element.extents
‘soft’: Dimension.soft_range values
‘hard’: Dimension.range values
To obtain the combined range, which includes range padding the default may be used:
‘combined’: All the range types combined and padding applied
This allows Overlay plots to obtain each range and combine them appropriately for all the objects in the overlay.
If lims_as_soft_ranges is set to True, the xlim and ylim will be treated as soft ranges instead of the default case as hard ranges while computing the extents. This is used e.g. when apply_hard_bounds is True and xlim/ylim is set, in which case we limit the initial viewable range to xlim/ylim, but allow navigation up to the abs max between the data range and xlim/ylim.
- get_padding(obj, extents)[source]#
Computes padding along the axes taking into account the plot aspect.
- get_zorder(overlay, key, el)[source]#
Computes the z-order of element in the NdOverlay taking into account possible batching of elements.
- init_artists(ax, plot_args, plot_kwargs)[source]#
Initializes the artist based on the plot method declared on the plot.
- refresh(**kwargs)[source]#
Refreshes the plot by rerendering it and then pushing the updated data if the plot has an associated Comm.
- property state#
The plotting state that gets updated via the update method and used by the renderer to generate output.
- teardown_handles()[source]#
If no custom update_handles method is supplied this method is called to tear down any previous handles before replacing them.
- traverse(fn=None, specs=None, full_breadth=True)[source]#
Traverses any nested DimensionedPlot returning a list of all plots that match the specs. The specs should be supplied as a list of either Plot types or callables, which should return a boolean given the plot class.
- update(key)[source]#
Update the internal state of the Plot to represent the given key tuple (where integers represent frames). Returns this state.
- class holoviews.plotting.mpl.annotation.SplinePlot(annotation, **params)[source]#
Bases:
AnnotationPlotDraw the supplied Spline annotation (see Spline docstring)
Parameters inherited from:
holoviews.plotting.plot.DimensionedPlot: fontsize, fontscale, show_title, title, normalizeholoviews.plotting.mpl.plot.MPLPlot: projection, backend_opts, fig_alpha, fig_bounds, fig_inches, fig_latex, fig_rcparams, fig_size, initial_hooks, sublabel_format, sublabel_position, sublabel_size, show_frameholoviews.plotting.plot.GenericElementPlot: apply_ranges, apply_extents, bgcolor, default_span, hooks, invert_axes, invert_xaxis, invert_yaxis, logx, logy, padding, show_grid, xaxis, yaxis, xlabel, ylabel, xlim, ylim, zlim, xrotation, yrotation, xticks, yticksholoviews.plotting.mpl.element.ElementPlot: apply_ticks, aspect, data_aspect, invert_zaxis, labelled, logz, xformatter, yformatter, zformatter, zaxis, zlabel, zrotation, zticksholoviews.plotting.mpl.annotation.AnnotationPlot: show_legend- anim(start=0, stop=None, fps=30)[source]#
Method to return a matplotlib animation. The start and stop frames may be specified as well as the fps.
- compute_ranges(obj, key, ranges)[source]#
Given an object, a specific key, and the normalization options, this method will find the specified normalization options on the appropriate OptionTree, group the elements according to the selected normalization option (i.e. either per frame or over the whole animation) and finally compute the dimension ranges in each group. The new set of ranges is returned.
- get_extents(element, ranges, range_type='combined', dimension=None, xdim=None, ydim=None, zdim=None, lims_as_soft_ranges=False, **kwargs)[source]#
Gets the extents for the axes from the current Element. The globally computed ranges can optionally override the extents.
The extents are computed by combining the data ranges, extents and dimension ranges. Each of these can be obtained individually by setting the range_type to one of:
‘data’: Just the data ranges
‘extents’: Element.extents
‘soft’: Dimension.soft_range values
‘hard’: Dimension.range values
To obtain the combined range, which includes range padding the default may be used:
‘combined’: All the range types combined and padding applied
This allows Overlay plots to obtain each range and combine them appropriately for all the objects in the overlay.
If lims_as_soft_ranges is set to True, the xlim and ylim will be treated as soft ranges instead of the default case as hard ranges while computing the extents. This is used e.g. when apply_hard_bounds is True and xlim/ylim is set, in which case we limit the initial viewable range to xlim/ylim, but allow navigation up to the abs max between the data range and xlim/ylim.
- get_padding(obj, extents)[source]#
Computes padding along the axes taking into account the plot aspect.
- get_zorder(overlay, key, el)[source]#
Computes the z-order of element in the NdOverlay taking into account possible batching of elements.
- init_artists(ax, plot_args, plot_kwargs)[source]#
Initializes the artist based on the plot method declared on the plot.
- refresh(**kwargs)[source]#
Refreshes the plot by rerendering it and then pushing the updated data if the plot has an associated Comm.
- property state#
The plotting state that gets updated via the update method and used by the renderer to generate output.
- teardown_handles()[source]#
If no custom update_handles method is supplied this method is called to tear down any previous handles before replacing them.
- traverse(fn=None, specs=None, full_breadth=True)[source]#
Traverses any nested DimensionedPlot returning a list of all plots that match the specs. The specs should be supplied as a list of either Plot types or callables, which should return a boolean given the plot class.
- update(key)[source]#
Update the internal state of the Plot to represent the given key tuple (where integers represent frames). Returns this state.
- class holoviews.plotting.mpl.annotation.TextPlot(annotation, **params)[source]#
Bases:
AnnotationPlotDraw the Text annotation object
Parameters inherited from:
holoviews.plotting.plot.DimensionedPlot: fontsize, fontscale, show_title, title, normalizeholoviews.plotting.mpl.plot.MPLPlot: projection, backend_opts, fig_alpha, fig_bounds, fig_inches, fig_latex, fig_rcparams, fig_size, initial_hooks, sublabel_format, sublabel_position, sublabel_size, show_frameholoviews.plotting.plot.GenericElementPlot: apply_ranges, apply_extents, bgcolor, default_span, hooks, invert_axes, invert_xaxis, invert_yaxis, logx, logy, padding, show_grid, xaxis, yaxis, xlabel, ylabel, xlim, ylim, zlim, xrotation, yrotation, xticks, yticksholoviews.plotting.mpl.element.ElementPlot: apply_ticks, aspect, data_aspect, invert_zaxis, labelled, logz, xformatter, yformatter, zformatter, zaxis, zlabel, zrotation, zticksholoviews.plotting.mpl.annotation.AnnotationPlot: show_legend- anim(start=0, stop=None, fps=30)[source]#
Method to return a matplotlib animation. The start and stop frames may be specified as well as the fps.
- compute_ranges(obj, key, ranges)[source]#
Given an object, a specific key, and the normalization options, this method will find the specified normalization options on the appropriate OptionTree, group the elements according to the selected normalization option (i.e. either per frame or over the whole animation) and finally compute the dimension ranges in each group. The new set of ranges is returned.
- get_extents(element, ranges, range_type='combined', dimension=None, xdim=None, ydim=None, zdim=None, lims_as_soft_ranges=False, **kwargs)[source]#
Gets the extents for the axes from the current Element. The globally computed ranges can optionally override the extents.
The extents are computed by combining the data ranges, extents and dimension ranges. Each of these can be obtained individually by setting the range_type to one of:
‘data’: Just the data ranges
‘extents’: Element.extents
‘soft’: Dimension.soft_range values
‘hard’: Dimension.range values
To obtain the combined range, which includes range padding the default may be used:
‘combined’: All the range types combined and padding applied
This allows Overlay plots to obtain each range and combine them appropriately for all the objects in the overlay.
If lims_as_soft_ranges is set to True, the xlim and ylim will be treated as soft ranges instead of the default case as hard ranges while computing the extents. This is used e.g. when apply_hard_bounds is True and xlim/ylim is set, in which case we limit the initial viewable range to xlim/ylim, but allow navigation up to the abs max between the data range and xlim/ylim.
- get_padding(obj, extents)[source]#
Computes padding along the axes taking into account the plot aspect.
- get_zorder(overlay, key, el)[source]#
Computes the z-order of element in the NdOverlay taking into account possible batching of elements.
- init_artists(ax, plot_args, plot_kwargs)[source]#
Initializes the artist based on the plot method declared on the plot.
- refresh(**kwargs)[source]#
Refreshes the plot by rerendering it and then pushing the updated data if the plot has an associated Comm.
- property state#
The plotting state that gets updated via the update method and used by the renderer to generate output.
- teardown_handles()[source]#
If no custom update_handles method is supplied this method is called to tear down any previous handles before replacing them.
- traverse(fn=None, specs=None, full_breadth=True)[source]#
Traverses any nested DimensionedPlot returning a list of all plots that match the specs. The specs should be supplied as a list of either Plot types or callables, which should return a boolean given the plot class.
- update(key)[source]#
Update the internal state of the Plot to represent the given key tuple (where integers represent frames). Returns this state.
- class holoviews.plotting.mpl.annotation.VLinePlot(annotation, **params)[source]#
Bases:
AnnotationPlotDraw a vertical line on the axis
Parameters inherited from:
holoviews.plotting.plot.DimensionedPlot: fontsize, fontscale, show_title, title, normalizeholoviews.plotting.mpl.plot.MPLPlot: projection, backend_opts, fig_alpha, fig_bounds, fig_inches, fig_latex, fig_rcparams, fig_size, initial_hooks, sublabel_format, sublabel_position, sublabel_size, show_frameholoviews.plotting.plot.GenericElementPlot: apply_ranges, apply_extents, bgcolor, default_span, hooks, invert_axes, invert_xaxis, invert_yaxis, logx, logy, padding, show_grid, xaxis, yaxis, xlabel, ylabel, xlim, ylim, zlim, xrotation, yrotation, xticks, yticksholoviews.plotting.mpl.element.ElementPlot: apply_ticks, aspect, data_aspect, invert_zaxis, labelled, logz, xformatter, yformatter, zformatter, zaxis, zlabel, zrotation, zticksholoviews.plotting.mpl.annotation.AnnotationPlot: show_legend- anim(start=0, stop=None, fps=30)[source]#
Method to return a matplotlib animation. The start and stop frames may be specified as well as the fps.
- compute_ranges(obj, key, ranges)[source]#
Given an object, a specific key, and the normalization options, this method will find the specified normalization options on the appropriate OptionTree, group the elements according to the selected normalization option (i.e. either per frame or over the whole animation) and finally compute the dimension ranges in each group. The new set of ranges is returned.
- get_extents(element, ranges, range_type='combined', dimension=None, xdim=None, ydim=None, zdim=None, lims_as_soft_ranges=False, **kwargs)[source]#
Gets the extents for the axes from the current Element. The globally computed ranges can optionally override the extents.
The extents are computed by combining the data ranges, extents and dimension ranges. Each of these can be obtained individually by setting the range_type to one of:
‘data’: Just the data ranges
‘extents’: Element.extents
‘soft’: Dimension.soft_range values
‘hard’: Dimension.range values
To obtain the combined range, which includes range padding the default may be used:
‘combined’: All the range types combined and padding applied
This allows Overlay plots to obtain each range and combine them appropriately for all the objects in the overlay.
If lims_as_soft_ranges is set to True, the xlim and ylim will be treated as soft ranges instead of the default case as hard ranges while computing the extents. This is used e.g. when apply_hard_bounds is True and xlim/ylim is set, in which case we limit the initial viewable range to xlim/ylim, but allow navigation up to the abs max between the data range and xlim/ylim.
- get_padding(obj, extents)[source]#
Computes padding along the axes taking into account the plot aspect.
- get_zorder(overlay, key, el)[source]#
Computes the z-order of element in the NdOverlay taking into account possible batching of elements.
- init_artists(ax, plot_args, plot_kwargs)[source]#
Initializes the artist based on the plot method declared on the plot.
- refresh(**kwargs)[source]#
Refreshes the plot by rerendering it and then pushing the updated data if the plot has an associated Comm.
- property state#
The plotting state that gets updated via the update method and used by the renderer to generate output.
- teardown_handles()[source]#
If no custom update_handles method is supplied this method is called to tear down any previous handles before replacing them.
- traverse(fn=None, specs=None, full_breadth=True)[source]#
Traverses any nested DimensionedPlot returning a list of all plots that match the specs. The specs should be supplied as a list of either Plot types or callables, which should return a boolean given the plot class.
- update(key)[source]#
Update the internal state of the Plot to represent the given key tuple (where integers represent frames). Returns this state.
- class holoviews.plotting.mpl.annotation.VLinesAnnotationPlot(annotation, **params)[source]#
Bases:
_SyntheticAnnotationPlotParameters inherited from:
holoviews.plotting.plot.DimensionedPlot: fontsize, fontscale, show_title, title, normalizeholoviews.plotting.mpl.plot.MPLPlot: projection, backend_opts, fig_alpha, fig_bounds, fig_inches, fig_latex, fig_rcparams, fig_size, initial_hooks, sublabel_format, sublabel_position, sublabel_size, show_frameholoviews.plotting.plot.GenericElementPlot: apply_extents, bgcolor, default_span, hooks, invert_axes, invert_xaxis, invert_yaxis, logx, logy, padding, show_grid, xaxis, yaxis, xlabel, ylabel, xlim, ylim, zlim, xrotation, yrotation, xticks, yticksholoviews.plotting.mpl.element.ElementPlot: apply_ticks, aspect, data_aspect, invert_zaxis, labelled, logz, xformatter, yformatter, zformatter, zaxis, zlabel, zrotation, zticksholoviews.plotting.mpl.annotation.AnnotationPlot: show_legendholoviews.plotting.mpl.annotation._SyntheticAnnotationPlot: apply_ranges- anim(start=0, stop=None, fps=30)[source]#
Method to return a matplotlib animation. The start and stop frames may be specified as well as the fps.
- compute_ranges(obj, key, ranges)[source]#
Given an object, a specific key, and the normalization options, this method will find the specified normalization options on the appropriate OptionTree, group the elements according to the selected normalization option (i.e. either per frame or over the whole animation) and finally compute the dimension ranges in each group. The new set of ranges is returned.
- get_extents(element, ranges=None, range_type='combined', **kwargs)[source]#
Gets the extents for the axes from the current Element. The globally computed ranges can optionally override the extents.
The extents are computed by combining the data ranges, extents and dimension ranges. Each of these can be obtained individually by setting the range_type to one of:
‘data’: Just the data ranges
‘extents’: Element.extents
‘soft’: Dimension.soft_range values
‘hard’: Dimension.range values
To obtain the combined range, which includes range padding the default may be used:
‘combined’: All the range types combined and padding applied
This allows Overlay plots to obtain each range and combine them appropriately for all the objects in the overlay.
If lims_as_soft_ranges is set to True, the xlim and ylim will be treated as soft ranges instead of the default case as hard ranges while computing the extents. This is used e.g. when apply_hard_bounds is True and xlim/ylim is set, in which case we limit the initial viewable range to xlim/ylim, but allow navigation up to the abs max between the data range and xlim/ylim.
- get_padding(obj, extents)[source]#
Computes padding along the axes taking into account the plot aspect.
- get_zorder(overlay, key, el)[source]#
Computes the z-order of element in the NdOverlay taking into account possible batching of elements.
- init_artists(ax, plot_args, plot_kwargs)[source]#
Initializes the artist based on the plot method declared on the plot.
- refresh(**kwargs)[source]#
Refreshes the plot by rerendering it and then pushing the updated data if the plot has an associated Comm.
- property state#
The plotting state that gets updated via the update method and used by the renderer to generate output.
- teardown_handles()[source]#
If no custom update_handles method is supplied this method is called to tear down any previous handles before replacing them.
- traverse(fn=None, specs=None, full_breadth=True)[source]#
Traverses any nested DimensionedPlot returning a list of all plots that match the specs. The specs should be supplied as a list of either Plot types or callables, which should return a boolean given the plot class.
- update(key)[source]#
Update the internal state of the Plot to represent the given key tuple (where integers represent frames). Returns this state.
- class holoviews.plotting.mpl.annotation.VSpanPlot(annotation, **params)[source]#
Bases:
AnnotationPlotDraw a vertical span on the axis
Parameters inherited from:
holoviews.plotting.plot.DimensionedPlot: fontsize, fontscale, show_title, title, normalizeholoviews.plotting.mpl.plot.MPLPlot: projection, backend_opts, fig_alpha, fig_bounds, fig_inches, fig_latex, fig_rcparams, fig_size, initial_hooks, sublabel_format, sublabel_position, sublabel_size, show_frameholoviews.plotting.plot.GenericElementPlot: apply_ranges, apply_extents, bgcolor, default_span, hooks, invert_axes, invert_xaxis, invert_yaxis, logx, logy, padding, show_grid, xaxis, yaxis, xlabel, ylabel, xlim, ylim, zlim, xrotation, yrotation, xticks, yticksholoviews.plotting.mpl.element.ElementPlot: apply_ticks, aspect, data_aspect, invert_zaxis, labelled, logz, xformatter, yformatter, zformatter, zaxis, zlabel, zrotation, zticksholoviews.plotting.mpl.annotation.AnnotationPlot: show_legend- anim(start=0, stop=None, fps=30)[source]#
Method to return a matplotlib animation. The start and stop frames may be specified as well as the fps.
- compute_ranges(obj, key, ranges)[source]#
Given an object, a specific key, and the normalization options, this method will find the specified normalization options on the appropriate OptionTree, group the elements according to the selected normalization option (i.e. either per frame or over the whole animation) and finally compute the dimension ranges in each group. The new set of ranges is returned.
- get_extents(element, ranges, range_type='combined', dimension=None, xdim=None, ydim=None, zdim=None, lims_as_soft_ranges=False, **kwargs)[source]#
Gets the extents for the axes from the current Element. The globally computed ranges can optionally override the extents.
The extents are computed by combining the data ranges, extents and dimension ranges. Each of these can be obtained individually by setting the range_type to one of:
‘data’: Just the data ranges
‘extents’: Element.extents
‘soft’: Dimension.soft_range values
‘hard’: Dimension.range values
To obtain the combined range, which includes range padding the default may be used:
‘combined’: All the range types combined and padding applied
This allows Overlay plots to obtain each range and combine them appropriately for all the objects in the overlay.
If lims_as_soft_ranges is set to True, the xlim and ylim will be treated as soft ranges instead of the default case as hard ranges while computing the extents. This is used e.g. when apply_hard_bounds is True and xlim/ylim is set, in which case we limit the initial viewable range to xlim/ylim, but allow navigation up to the abs max between the data range and xlim/ylim.
- get_padding(obj, extents)[source]#
Computes padding along the axes taking into account the plot aspect.
- get_zorder(overlay, key, el)[source]#
Computes the z-order of element in the NdOverlay taking into account possible batching of elements.
- init_artists(ax, plot_args, plot_kwargs)[source]#
Initializes the artist based on the plot method declared on the plot.
- refresh(**kwargs)[source]#
Refreshes the plot by rerendering it and then pushing the updated data if the plot has an associated Comm.
- property state#
The plotting state that gets updated via the update method and used by the renderer to generate output.
- teardown_handles()[source]#
If no custom update_handles method is supplied this method is called to tear down any previous handles before replacing them.
- traverse(fn=None, specs=None, full_breadth=True)[source]#
Traverses any nested DimensionedPlot returning a list of all plots that match the specs. The specs should be supplied as a list of either Plot types or callables, which should return a boolean given the plot class.
- update(key)[source]#
Update the internal state of the Plot to represent the given key tuple (where integers represent frames). Returns this state.
- class holoviews.plotting.mpl.annotation.VSpansAnnotationPlot(annotation, **params)[source]#
Bases:
_SyntheticAnnotationPlotParameters inherited from:
holoviews.plotting.plot.DimensionedPlot: fontsize, fontscale, show_title, title, normalizeholoviews.plotting.mpl.plot.MPLPlot: projection, backend_opts, fig_alpha, fig_bounds, fig_inches, fig_latex, fig_rcparams, fig_size, initial_hooks, sublabel_format, sublabel_position, sublabel_size, show_frameholoviews.plotting.plot.GenericElementPlot: apply_extents, bgcolor, default_span, hooks, invert_axes, invert_xaxis, invert_yaxis, logx, logy, padding, show_grid, xaxis, yaxis, xlabel, ylabel, xlim, ylim, zlim, xrotation, yrotation, xticks, yticksholoviews.plotting.mpl.element.ElementPlot: apply_ticks, aspect, data_aspect, invert_zaxis, labelled, logz, xformatter, yformatter, zformatter, zaxis, zlabel, zrotation, zticksholoviews.plotting.mpl.annotation.AnnotationPlot: show_legendholoviews.plotting.mpl.annotation._SyntheticAnnotationPlot: apply_ranges- anim(start=0, stop=None, fps=30)[source]#
Method to return a matplotlib animation. The start and stop frames may be specified as well as the fps.
- compute_ranges(obj, key, ranges)[source]#
Given an object, a specific key, and the normalization options, this method will find the specified normalization options on the appropriate OptionTree, group the elements according to the selected normalization option (i.e. either per frame or over the whole animation) and finally compute the dimension ranges in each group. The new set of ranges is returned.
- get_extents(element, ranges=None, range_type='combined', **kwargs)[source]#
Gets the extents for the axes from the current Element. The globally computed ranges can optionally override the extents.
The extents are computed by combining the data ranges, extents and dimension ranges. Each of these can be obtained individually by setting the range_type to one of:
‘data’: Just the data ranges
‘extents’: Element.extents
‘soft’: Dimension.soft_range values
‘hard’: Dimension.range values
To obtain the combined range, which includes range padding the default may be used:
‘combined’: All the range types combined and padding applied
This allows Overlay plots to obtain each range and combine them appropriately for all the objects in the overlay.
If lims_as_soft_ranges is set to True, the xlim and ylim will be treated as soft ranges instead of the default case as hard ranges while computing the extents. This is used e.g. when apply_hard_bounds is True and xlim/ylim is set, in which case we limit the initial viewable range to xlim/ylim, but allow navigation up to the abs max between the data range and xlim/ylim.
- get_padding(obj, extents)[source]#
Computes padding along the axes taking into account the plot aspect.
- get_zorder(overlay, key, el)[source]#
Computes the z-order of element in the NdOverlay taking into account possible batching of elements.
- init_artists(ax, plot_args, plot_kwargs)[source]#
Initializes the artist based on the plot method declared on the plot.
- refresh(**kwargs)[source]#
Refreshes the plot by rerendering it and then pushing the updated data if the plot has an associated Comm.
- property state#
The plotting state that gets updated via the update method and used by the renderer to generate output.
- teardown_handles()[source]#
If no custom update_handles method is supplied this method is called to tear down any previous handles before replacing them.
- traverse(fn=None, specs=None, full_breadth=True)[source]#
Traverses any nested DimensionedPlot returning a list of all plots that match the specs. The specs should be supplied as a list of either Plot types or callables, which should return a boolean given the plot class.
- update(key)[source]#
Update the internal state of the Plot to represent the given key tuple (where integers represent frames). Returns this state.
chart Module#
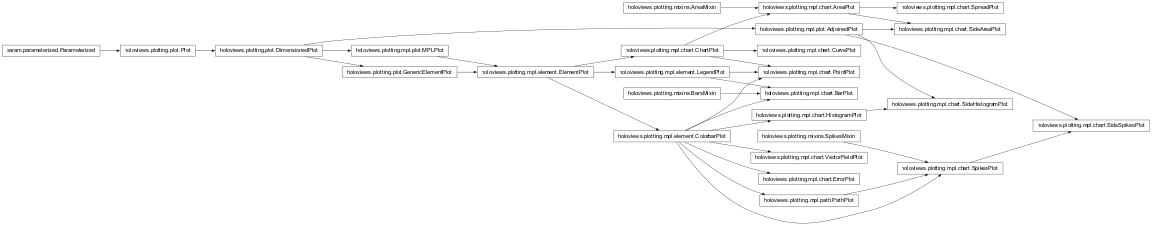
- class holoviews.plotting.mpl.chart.AreaPlot(element, **params)[source]#
Bases:
AreaMixin,ChartPlotParameters inherited from:
holoviews.plotting.plot.DimensionedPlot: fontsize, fontscale, show_title, title, normalizeholoviews.plotting.mpl.plot.MPLPlot: projection, backend_opts, fig_alpha, fig_bounds, fig_inches, fig_latex, fig_rcparams, fig_size, initial_hooks, sublabel_format, sublabel_position, sublabel_size, show_frameholoviews.plotting.plot.GenericElementPlot: apply_ranges, apply_extents, bgcolor, default_span, hooks, invert_axes, invert_xaxis, invert_yaxis, logx, logy, show_grid, xaxis, yaxis, xlabel, ylabel, xlim, ylim, zlim, xrotation, yrotation, xticks, yticksholoviews.plotting.mpl.element.ElementPlot: apply_ticks, aspect, data_aspect, invert_zaxis, labelled, logz, xformatter, yformatter, zformatter, zaxis, zlabel, zrotation, ztickspadding= param.ClassSelector(allow_refs=False, class_=(<class ‘int’>, <class ‘float’>, <class ‘tuple’>), default=(0, 0.1), label=’Padding’, nested_refs=False, rx=<param.reactive.reactive_ops object at 0x7f6aedb7a310>)Fraction by which to increase auto-ranged extents to make datapoints more visible around borders. To compute padding, the axis whose screen size is largest is chosen, and the range of that axis is increased by the specified fraction along each axis. Other axes are then padded ensuring that the amount of screen space devoted to padding is equal for all axes. If specified as a tuple, the int or float values in the tuple will be used for padding in each axis, in order (x,y or x,y,z). For example, for padding=0.2 on a 800x800-pixel plot, an x-axis with the range [0,10] will be padded by 20% to be [-1,11], while a y-axis with a range [0,1000] will be padded to be [-100,1100], which should make the padding be approximately the same number of pixels. But if the same plot is changed to have a height of only 200, the y-range will then be [-400,1400] so that the y-axis padding will still match that of the x-axis. It is also possible to declare non-equal padding value for the lower and upper bound of an axis by supplying nested tuples, e.g. padding=(0.1, (0, 0.1)) will pad the x-axis lower and upper bound as well as the y-axis upper bound by a fraction of 0.1 while the y-axis lower bound is not padded at all.
show_legend= param.Boolean(allow_refs=False, default=False, label=’Show legend’, nested_refs=False, rx=<param.reactive.reactive_ops object at 0x7f6aedb7ba10>)Whether to show legend for the plot.
- anim(start=0, stop=None, fps=30)[source]#
Method to return a matplotlib animation. The start and stop frames may be specified as well as the fps.
- compute_ranges(obj, key, ranges)[source]#
Given an object, a specific key, and the normalization options, this method will find the specified normalization options on the appropriate OptionTree, group the elements according to the selected normalization option (i.e. either per frame or over the whole animation) and finally compute the dimension ranges in each group. The new set of ranges is returned.
- get_extents(element, ranges, range_type='combined', **kwargs)[source]#
Gets the extents for the axes from the current Element. The globally computed ranges can optionally override the extents.
The extents are computed by combining the data ranges, extents and dimension ranges. Each of these can be obtained individually by setting the range_type to one of:
‘data’: Just the data ranges
‘extents’: Element.extents
‘soft’: Dimension.soft_range values
‘hard’: Dimension.range values
To obtain the combined range, which includes range padding the default may be used:
‘combined’: All the range types combined and padding applied
This allows Overlay plots to obtain each range and combine them appropriately for all the objects in the overlay.
If lims_as_soft_ranges is set to True, the xlim and ylim will be treated as soft ranges instead of the default case as hard ranges while computing the extents. This is used e.g. when apply_hard_bounds is True and xlim/ylim is set, in which case we limit the initial viewable range to xlim/ylim, but allow navigation up to the abs max between the data range and xlim/ylim.
- get_padding(obj, extents)[source]#
Computes padding along the axes taking into account the plot aspect.
- get_zorder(overlay, key, el)[source]#
Computes the z-order of element in the NdOverlay taking into account possible batching of elements.
- init_artists(ax, plot_data, plot_kwargs)[source]#
Initializes the artist based on the plot method declared on the plot.
- refresh(**kwargs)[source]#
Refreshes the plot by rerendering it and then pushing the updated data if the plot has an associated Comm.
- property state#
The plotting state that gets updated via the update method and used by the renderer to generate output.
- teardown_handles()[source]#
If no custom update_handles method is supplied this method is called to tear down any previous handles before replacing them.
- traverse(fn=None, specs=None, full_breadth=True)[source]#
Traverses any nested DimensionedPlot returning a list of all plots that match the specs. The specs should be supplied as a list of either Plot types or callables, which should return a boolean given the plot class.
- update(key)[source]#
Update the internal state of the Plot to represent the given key tuple (where integers represent frames). Returns this state.
- class holoviews.plotting.mpl.chart.BarPlot(*args, **kwargs)[source]#
Bases:
BarsMixin,ColorbarPlot,LegendPlotParameters inherited from:
holoviews.plotting.plot.DimensionedPlot: fontsize, fontscale, show_title, title, normalizeholoviews.plotting.mpl.plot.MPLPlot: projection, backend_opts, fig_alpha, fig_bounds, fig_inches, fig_latex, fig_rcparams, fig_size, initial_hooks, sublabel_format, sublabel_position, sublabel_size, show_frameholoviews.plotting.plot.GenericElementPlot: apply_ranges, apply_extents, bgcolor, default_span, hooks, invert_axes, invert_xaxis, invert_yaxis, logx, logy, padding, show_grid, xaxis, yaxis, xlabel, ylabel, xlim, ylim, zlim, xrotation, yrotation, xticks, yticksholoviews.plotting.mpl.element.ElementPlot: apply_ticks, aspect, data_aspect, invert_zaxis, labelled, logz, xformatter, yformatter, zformatter, zaxis, zlabel, zrotation, zticksholoviews.plotting.mpl.element.LegendPlot: legend_cols, legend_labels, legend_position, legend_optsholoviews.plotting.mpl.element.ColorbarPlot: clabel, clim, clim_percentile, cformatter, colorbar, colorbar_opts, color_levels, cnorm, clipping_colors, cbar_padding, cbar_ticks, cbar_width, cbar_extend, rescale_discrete_levels, symmetricshow_legend= param.Boolean(allow_refs=False, default=True, label=’Show legend’, nested_refs=False, rx=<param.reactive.reactive_ops object at 0x7f6aed9bda90>)Whether to show legend for the plot.
bar_padding= param.Number(allow_refs=False, default=0.2, inclusive_bounds=(True, True), label=’Bar padding’, nested_refs=False, rx=<param.reactive.reactive_ops object at 0x7f6aed9bf690>)Defines the padding between groups.
multi_level= param.Boolean(allow_refs=False, default=True, label=’Multi level’, nested_refs=False, rx=<param.reactive.reactive_ops object at 0x7f6aed9bda10>)Whether the Bars should be grouped into a second categorical axis level.
stacked= param.Boolean(allow_refs=False, default=False, label=’Stacked’, nested_refs=False, rx=<param.reactive.reactive_ops object at 0x7f6aed9bedd0>)Whether the bars should be stacked or grouped.
- anim(start=0, stop=None, fps=30)[source]#
Method to return a matplotlib animation. The start and stop frames may be specified as well as the fps.
- compute_ranges(obj, key, ranges)[source]#
Given an object, a specific key, and the normalization options, this method will find the specified normalization options on the appropriate OptionTree, group the elements according to the selected normalization option (i.e. either per frame or over the whole animation) and finally compute the dimension ranges in each group. The new set of ranges is returned.
- get_extents(element, ranges, range_type='combined', **kwargs)[source]#
Make adjustments to plot extents by computing stacked bar heights, adjusting the bar baseline and forcing the x-axis to be categorical.
- get_padding(obj, extents)[source]#
Computes padding along the axes taking into account the plot aspect.
- get_zorder(overlay, key, el)[source]#
Computes the z-order of element in the NdOverlay taking into account possible batching of elements.
- init_artists(ax, plot_args, plot_kwargs)[source]#
Initializes the artist based on the plot method declared on the plot.
- refresh(**kwargs)[source]#
Refreshes the plot by rerendering it and then pushing the updated data if the plot has an associated Comm.
- property state#
The plotting state that gets updated via the update method and used by the renderer to generate output.
- teardown_handles()[source]#
If no custom update_handles method is supplied this method is called to tear down any previous handles before replacing them.
- traverse(fn=None, specs=None, full_breadth=True)[source]#
Traverses any nested DimensionedPlot returning a list of all plots that match the specs. The specs should be supplied as a list of either Plot types or callables, which should return a boolean given the plot class.
- update(key)[source]#
Update the internal state of the Plot to represent the given key tuple (where integers represent frames). Returns this state.
- class holoviews.plotting.mpl.chart.ChartPlot(element, **params)[source]#
Bases:
ElementPlotBaseclass to plot Chart elements.
Parameters inherited from:
holoviews.plotting.plot.DimensionedPlot: fontsize, fontscale, show_title, title, normalizeholoviews.plotting.mpl.plot.MPLPlot: projection, backend_opts, fig_alpha, fig_bounds, fig_inches, fig_latex, fig_rcparams, fig_size, initial_hooks, sublabel_format, sublabel_position, sublabel_size, show_frameholoviews.plotting.plot.GenericElementPlot: apply_ranges, apply_extents, bgcolor, default_span, hooks, invert_axes, invert_xaxis, invert_yaxis, logx, logy, padding, show_legend, show_grid, xaxis, yaxis, xlabel, ylabel, xlim, ylim, zlim, xrotation, yrotation, xticks, yticksholoviews.plotting.mpl.element.ElementPlot: apply_ticks, aspect, data_aspect, invert_zaxis, labelled, logz, xformatter, yformatter, zformatter, zaxis, zlabel, zrotation, zticks- anim(start=0, stop=None, fps=30)[source]#
Method to return a matplotlib animation. The start and stop frames may be specified as well as the fps.
- compute_ranges(obj, key, ranges)[source]#
Given an object, a specific key, and the normalization options, this method will find the specified normalization options on the appropriate OptionTree, group the elements according to the selected normalization option (i.e. either per frame or over the whole animation) and finally compute the dimension ranges in each group. The new set of ranges is returned.
- get_extents(element, ranges, range_type='combined', dimension=None, xdim=None, ydim=None, zdim=None, lims_as_soft_ranges=False, **kwargs)[source]#
Gets the extents for the axes from the current Element. The globally computed ranges can optionally override the extents.
The extents are computed by combining the data ranges, extents and dimension ranges. Each of these can be obtained individually by setting the range_type to one of:
‘data’: Just the data ranges
‘extents’: Element.extents
‘soft’: Dimension.soft_range values
‘hard’: Dimension.range values
To obtain the combined range, which includes range padding the default may be used:
‘combined’: All the range types combined and padding applied
This allows Overlay plots to obtain each range and combine them appropriately for all the objects in the overlay.
If lims_as_soft_ranges is set to True, the xlim and ylim will be treated as soft ranges instead of the default case as hard ranges while computing the extents. This is used e.g. when apply_hard_bounds is True and xlim/ylim is set, in which case we limit the initial viewable range to xlim/ylim, but allow navigation up to the abs max between the data range and xlim/ylim.
- get_padding(obj, extents)[source]#
Computes padding along the axes taking into account the plot aspect.
- get_zorder(overlay, key, el)[source]#
Computes the z-order of element in the NdOverlay taking into account possible batching of elements.
- init_artists(ax, plot_args, plot_kwargs)[source]#
Initializes the artist based on the plot method declared on the plot.
- refresh(**kwargs)[source]#
Refreshes the plot by rerendering it and then pushing the updated data if the plot has an associated Comm.
- property state#
The plotting state that gets updated via the update method and used by the renderer to generate output.
- teardown_handles()[source]#
If no custom update_handles method is supplied this method is called to tear down any previous handles before replacing them.
- traverse(fn=None, specs=None, full_breadth=True)[source]#
Traverses any nested DimensionedPlot returning a list of all plots that match the specs. The specs should be supplied as a list of either Plot types or callables, which should return a boolean given the plot class.
- update(key)[source]#
Update the internal state of the Plot to represent the given key tuple (where integers represent frames). Returns this state.
- class holoviews.plotting.mpl.chart.CurvePlot(element, **params)[source]#
Bases:
ChartPlotCurvePlot can plot Curve and ViewMaps of Curve, which can be displayed as a single frame or animation. Axes, titles and legends are automatically generated from dim_info.
If the dimension is set to cyclic in the dim_info it will rotate the curve so that minimum y values are at the minimum x value to make the plots easier to interpret.
Parameters inherited from:
holoviews.plotting.plot.DimensionedPlot: fontsize, fontscale, show_title, title, normalizeholoviews.plotting.mpl.plot.MPLPlot: projection, backend_opts, fig_alpha, fig_bounds, fig_inches, fig_latex, fig_rcparams, fig_size, initial_hooks, sublabel_format, sublabel_position, sublabel_size, show_frameholoviews.plotting.plot.GenericElementPlot: apply_ranges, apply_extents, bgcolor, default_span, hooks, invert_axes, invert_xaxis, invert_yaxis, logx, logy, xaxis, yaxis, xlabel, ylabel, xlim, ylim, zlim, xrotation, yrotation, xticks, yticksholoviews.plotting.mpl.element.ElementPlot: apply_ticks, aspect, data_aspect, invert_zaxis, labelled, logz, xformatter, yformatter, zformatter, zaxis, zlabel, zrotation, ztickspadding= param.ClassSelector(allow_refs=False, class_=(<class ‘int’>, <class ‘float’>, <class ‘tuple’>), default=(0, 0.1), label=’Padding’, nested_refs=False, rx=<param.reactive.reactive_ops object at 0x7f6aed9c7450>)Fraction by which to increase auto-ranged extents to make datapoints more visible around borders. To compute padding, the axis whose screen size is largest is chosen, and the range of that axis is increased by the specified fraction along each axis. Other axes are then padded ensuring that the amount of screen space devoted to padding is equal for all axes. If specified as a tuple, the int or float values in the tuple will be used for padding in each axis, in order (x,y or x,y,z). For example, for padding=0.2 on a 800x800-pixel plot, an x-axis with the range [0,10] will be padded by 20% to be [-1,11], while a y-axis with a range [0,1000] will be padded to be [-100,1100], which should make the padding be approximately the same number of pixels. But if the same plot is changed to have a height of only 200, the y-range will then be [-400,1400] so that the y-axis padding will still match that of the x-axis. It is also possible to declare non-equal padding value for the lower and upper bound of an axis by supplying nested tuples, e.g. padding=(0.1, (0, 0.1)) will pad the x-axis lower and upper bound as well as the y-axis upper bound by a fraction of 0.1 while the y-axis lower bound is not padded at all.
show_legend= param.Boolean(allow_refs=False, default=True, label=’Show legend’, nested_refs=False, rx=<param.reactive.reactive_ops object at 0x7f6aed9fd050>)Whether to show legend for the plot.
show_grid= param.Boolean(allow_refs=False, default=False, label=’Show grid’, nested_refs=False, rx=<param.reactive.reactive_ops object at 0x7f6aed9c7150>)Enable axis grid.
autotick= param.Boolean(allow_refs=False, default=False, label=’Autotick’, nested_refs=False, rx=<param.reactive.reactive_ops object at 0x7f6aed9fcb50>)Whether to let matplotlib automatically compute tick marks or to allow the user to control tick marks.
interpolation= param.ObjectSelector(allow_refs=False, default=’linear’, label=’Interpolation’, names={}, nested_refs=False, objects=[‘linear’, ‘steps-mid’, ‘steps-pre’, ‘steps-post’], rx=<param.reactive.reactive_ops object at 0x7f6aeeaf25d0>)Defines how the samples of the Curve are interpolated, default is ‘linear’, other options include ‘steps-mid’, ‘steps-pre’ and ‘steps-post’.
relative_labels= param.Boolean(allow_refs=False, default=False, label=’Relative labels’, nested_refs=False, rx=<param.reactive.reactive_ops object at 0x7f6aed9fc910>)If plotted quantity is cyclic and center_cyclic is enabled, will compute tick labels relative to the center.
- anim(start=0, stop=None, fps=30)[source]#
Method to return a matplotlib animation. The start and stop frames may be specified as well as the fps.
- compute_ranges(obj, key, ranges)[source]#
Given an object, a specific key, and the normalization options, this method will find the specified normalization options on the appropriate OptionTree, group the elements according to the selected normalization option (i.e. either per frame or over the whole animation) and finally compute the dimension ranges in each group. The new set of ranges is returned.
- get_extents(element, ranges, range_type='combined', dimension=None, xdim=None, ydim=None, zdim=None, lims_as_soft_ranges=False, **kwargs)[source]#
Gets the extents for the axes from the current Element. The globally computed ranges can optionally override the extents.
The extents are computed by combining the data ranges, extents and dimension ranges. Each of these can be obtained individually by setting the range_type to one of:
‘data’: Just the data ranges
‘extents’: Element.extents
‘soft’: Dimension.soft_range values
‘hard’: Dimension.range values
To obtain the combined range, which includes range padding the default may be used:
‘combined’: All the range types combined and padding applied
This allows Overlay plots to obtain each range and combine them appropriately for all the objects in the overlay.
If lims_as_soft_ranges is set to True, the xlim and ylim will be treated as soft ranges instead of the default case as hard ranges while computing the extents. This is used e.g. when apply_hard_bounds is True and xlim/ylim is set, in which case we limit the initial viewable range to xlim/ylim, but allow navigation up to the abs max between the data range and xlim/ylim.
- get_padding(obj, extents)[source]#
Computes padding along the axes taking into account the plot aspect.
- get_zorder(overlay, key, el)[source]#
Computes the z-order of element in the NdOverlay taking into account possible batching of elements.
- init_artists(ax, plot_args, plot_kwargs)[source]#
Initializes the artist based on the plot method declared on the plot.
- refresh(**kwargs)[source]#
Refreshes the plot by rerendering it and then pushing the updated data if the plot has an associated Comm.
- property state#
The plotting state that gets updated via the update method and used by the renderer to generate output.
- teardown_handles()[source]#
If no custom update_handles method is supplied this method is called to tear down any previous handles before replacing them.
- traverse(fn=None, specs=None, full_breadth=True)[source]#
Traverses any nested DimensionedPlot returning a list of all plots that match the specs. The specs should be supplied as a list of either Plot types or callables, which should return a boolean given the plot class.
- update(key)[source]#
Update the internal state of the Plot to represent the given key tuple (where integers represent frames). Returns this state.
- class holoviews.plotting.mpl.chart.ErrorPlot(*args, **kwargs)[source]#
Bases:
ColorbarPlotErrorPlot plots the ErrorBar Element type and supporting both horizontal and vertical error bars via the ‘horizontal’ plot option.
Parameters inherited from:
holoviews.plotting.plot.DimensionedPlot: fontsize, fontscale, show_title, title, normalizeholoviews.plotting.mpl.plot.MPLPlot: projection, backend_opts, fig_alpha, fig_bounds, fig_inches, fig_latex, fig_rcparams, fig_size, initial_hooks, sublabel_format, sublabel_position, sublabel_size, show_frameholoviews.plotting.plot.GenericElementPlot: apply_ranges, apply_extents, bgcolor, default_span, hooks, invert_axes, invert_xaxis, invert_yaxis, logx, logy, padding, show_legend, show_grid, xaxis, yaxis, xlabel, ylabel, xlim, ylim, zlim, xrotation, yrotation, xticks, yticksholoviews.plotting.mpl.element.ElementPlot: apply_ticks, aspect, data_aspect, invert_zaxis, labelled, logz, xformatter, yformatter, zformatter, zaxis, zlabel, zrotation, zticksholoviews.plotting.mpl.element.ColorbarPlot: clabel, clim, clim_percentile, cformatter, colorbar, colorbar_opts, color_levels, cnorm, clipping_colors, cbar_padding, cbar_ticks, cbar_width, cbar_extend, rescale_discrete_levels, symmetric- anim(start=0, stop=None, fps=30)[source]#
Method to return a matplotlib animation. The start and stop frames may be specified as well as the fps.
- compute_ranges(obj, key, ranges)[source]#
Given an object, a specific key, and the normalization options, this method will find the specified normalization options on the appropriate OptionTree, group the elements according to the selected normalization option (i.e. either per frame or over the whole animation) and finally compute the dimension ranges in each group. The new set of ranges is returned.
- get_extents(element, ranges, range_type='combined', dimension=None, xdim=None, ydim=None, zdim=None, lims_as_soft_ranges=False, **kwargs)[source]#
Gets the extents for the axes from the current Element. The globally computed ranges can optionally override the extents.
The extents are computed by combining the data ranges, extents and dimension ranges. Each of these can be obtained individually by setting the range_type to one of:
‘data’: Just the data ranges
‘extents’: Element.extents
‘soft’: Dimension.soft_range values
‘hard’: Dimension.range values
To obtain the combined range, which includes range padding the default may be used:
‘combined’: All the range types combined and padding applied
This allows Overlay plots to obtain each range and combine them appropriately for all the objects in the overlay.
If lims_as_soft_ranges is set to True, the xlim and ylim will be treated as soft ranges instead of the default case as hard ranges while computing the extents. This is used e.g. when apply_hard_bounds is True and xlim/ylim is set, in which case we limit the initial viewable range to xlim/ylim, but allow navigation up to the abs max between the data range and xlim/ylim.
- get_padding(obj, extents)[source]#
Computes padding along the axes taking into account the plot aspect.
- get_zorder(overlay, key, el)[source]#
Computes the z-order of element in the NdOverlay taking into account possible batching of elements.
- init_artists(ax, plot_data, plot_kwargs)[source]#
Initializes the artist based on the plot method declared on the plot.
- refresh(**kwargs)[source]#
Refreshes the plot by rerendering it and then pushing the updated data if the plot has an associated Comm.
- property state#
The plotting state that gets updated via the update method and used by the renderer to generate output.
- teardown_handles()[source]#
If no custom update_handles method is supplied this method is called to tear down any previous handles before replacing them.
- traverse(fn=None, specs=None, full_breadth=True)[source]#
Traverses any nested DimensionedPlot returning a list of all plots that match the specs. The specs should be supplied as a list of either Plot types or callables, which should return a boolean given the plot class.
- update(key)[source]#
Update the internal state of the Plot to represent the given key tuple (where integers represent frames). Returns this state.
- class holoviews.plotting.mpl.chart.HistogramPlot(histograms, **params)[source]#
Bases:
ColorbarPlotHistogramPlot can plot DataHistograms and ViewMaps of DataHistograms, which can be displayed as a single frame or animation.
Parameters inherited from:
holoviews.plotting.plot.DimensionedPlot: fontsize, fontscale, show_title, title, normalizeholoviews.plotting.mpl.plot.MPLPlot: projection, backend_opts, fig_alpha, fig_bounds, fig_inches, fig_latex, fig_rcparams, fig_size, initial_hooks, sublabel_format, sublabel_position, sublabel_size, show_frameholoviews.plotting.plot.GenericElementPlot: apply_ranges, apply_extents, bgcolor, default_span, hooks, invert_axes, invert_xaxis, invert_yaxis, logx, logy, padding, show_legend, show_grid, xaxis, yaxis, xlabel, ylabel, xlim, ylim, zlim, xrotation, yrotation, xticks, yticksholoviews.plotting.mpl.element.ElementPlot: apply_ticks, aspect, data_aspect, invert_zaxis, labelled, logz, xformatter, yformatter, zformatter, zaxis, zlabel, zrotation, zticksholoviews.plotting.mpl.element.ColorbarPlot: clabel, clim, clim_percentile, cformatter, colorbar, colorbar_opts, color_levels, cnorm, clipping_colors, cbar_padding, cbar_ticks, cbar_width, cbar_extend, rescale_discrete_levels, symmetric- anim(start=0, stop=None, fps=30)[source]#
Method to return a matplotlib animation. The start and stop frames may be specified as well as the fps.
- compute_ranges(obj, key, ranges)[source]#
Given an object, a specific key, and the normalization options, this method will find the specified normalization options on the appropriate OptionTree, group the elements according to the selected normalization option (i.e. either per frame or over the whole animation) and finally compute the dimension ranges in each group. The new set of ranges is returned.
- get_extents(element, ranges, range_type='combined', **kwargs)[source]#
Gets the extents for the axes from the current Element. The globally computed ranges can optionally override the extents.
The extents are computed by combining the data ranges, extents and dimension ranges. Each of these can be obtained individually by setting the range_type to one of:
‘data’: Just the data ranges
‘extents’: Element.extents
‘soft’: Dimension.soft_range values
‘hard’: Dimension.range values
To obtain the combined range, which includes range padding the default may be used:
‘combined’: All the range types combined and padding applied
This allows Overlay plots to obtain each range and combine them appropriately for all the objects in the overlay.
If lims_as_soft_ranges is set to True, the xlim and ylim will be treated as soft ranges instead of the default case as hard ranges while computing the extents. This is used e.g. when apply_hard_bounds is True and xlim/ylim is set, in which case we limit the initial viewable range to xlim/ylim, but allow navigation up to the abs max between the data range and xlim/ylim.
- get_padding(obj, extents)[source]#
Computes padding along the axes taking into account the plot aspect.
- get_zorder(overlay, key, el)[source]#
Computes the z-order of element in the NdOverlay taking into account possible batching of elements.
- init_artists(ax, plot_args, plot_kwargs)[source]#
Initializes the artist based on the plot method declared on the plot.
- refresh(**kwargs)[source]#
Refreshes the plot by rerendering it and then pushing the updated data if the plot has an associated Comm.
- property state#
The plotting state that gets updated via the update method and used by the renderer to generate output.
- teardown_handles()[source]#
If no custom update_handles method is supplied this method is called to tear down any previous handles before replacing them.
- traverse(fn=None, specs=None, full_breadth=True)[source]#
Traverses any nested DimensionedPlot returning a list of all plots that match the specs. The specs should be supplied as a list of either Plot types or callables, which should return a boolean given the plot class.
- update(key)[source]#
Update the internal state of the Plot to represent the given key tuple (where integers represent frames). Returns this state.
- class holoviews.plotting.mpl.chart.PointPlot(*args, **kwargs)[source]#
Bases:
ChartPlot,ColorbarPlot,LegendPlotNote that the ‘cmap’, ‘vmin’ and ‘vmax’ style arguments control how point magnitudes are rendered to different colors.
Parameters inherited from:
holoviews.plotting.plot.DimensionedPlot: fontsize, fontscale, show_title, title, normalizeholoviews.plotting.mpl.plot.MPLPlot: projection, backend_opts, fig_alpha, fig_bounds, fig_inches, fig_latex, fig_rcparams, fig_size, initial_hooks, sublabel_format, sublabel_position, sublabel_size, show_frameholoviews.plotting.plot.GenericElementPlot: apply_ranges, apply_extents, bgcolor, default_span, hooks, invert_axes, invert_xaxis, invert_yaxis, logx, logy, padding, xaxis, yaxis, xlabel, ylabel, xlim, ylim, zlim, xrotation, yrotation, xticks, yticksholoviews.plotting.mpl.element.ElementPlot: apply_ticks, aspect, data_aspect, invert_zaxis, labelled, logz, xformatter, yformatter, zformatter, zaxis, zlabel, zrotation, zticksholoviews.plotting.mpl.element.LegendPlot: show_legend, legend_cols, legend_labels, legend_position, legend_optsholoviews.plotting.mpl.element.ColorbarPlot: clabel, clim, clim_percentile, cformatter, colorbar, colorbar_opts, color_levels, cnorm, clipping_colors, cbar_padding, cbar_ticks, cbar_width, cbar_extend, rescale_discrete_levels, symmetricshow_grid= param.Boolean(allow_refs=False, default=False, label=’Show grid’, nested_refs=False, rx=<param.reactive.reactive_ops object at 0x7f6aeda3b310>)Whether to draw grid lines at the tick positions.
color_index= param.ClassSelector(allow_None=True, allow_refs=False, class_=(<class ‘str’>, <class ‘int’>), label=’Color index’, nested_refs=False, rx=<param.reactive.reactive_ops object at 0x7f6aeda397d0>)Deprecated in favor of color style mapping, e.g. color=dim(‘color’)
size_index= param.ClassSelector(allow_None=True, allow_refs=False, class_=(<class ‘str’>, <class ‘int’>), label=’Size index’, nested_refs=False, rx=<param.reactive.reactive_ops object at 0x7f6aeda385d0>)Deprecated in favor of size style mapping, e.g. size=dim(‘size’)
scaling_method= param.ObjectSelector(allow_refs=False, default=’area’, label=’Scaling method’, names={}, nested_refs=False, objects=[‘width’, ‘area’], rx=<param.reactive.reactive_ops object at 0x7f6aeda35250>)Deprecated in favor of size style mapping, e.g. size=dim(‘size’)**2.
scaling_factor= param.Number(allow_refs=False, bounds=(0, None), default=1, inclusive_bounds=(True, True), label=’Scaling factor’, nested_refs=False, rx=<param.reactive.reactive_ops object at 0x7f6aeda34fd0>)Scaling factor which is applied to either the width or area of each point, depending on the value of scaling_method.
size_fn= param.Callable(allow_refs=False, default=<ufunc ‘absolute’>, label=’Size fn’, nested_refs=False, rx=<param.reactive.reactive_ops object at 0x7f6aeda35a90>)Function applied to size values before applying scaling, to remove values lower than zero.
- anim(start=0, stop=None, fps=30)[source]#
Method to return a matplotlib animation. The start and stop frames may be specified as well as the fps.
- compute_ranges(obj, key, ranges)[source]#
Given an object, a specific key, and the normalization options, this method will find the specified normalization options on the appropriate OptionTree, group the elements according to the selected normalization option (i.e. either per frame or over the whole animation) and finally compute the dimension ranges in each group. The new set of ranges is returned.
- get_extents(element, ranges, range_type='combined', dimension=None, xdim=None, ydim=None, zdim=None, lims_as_soft_ranges=False, **kwargs)[source]#
Gets the extents for the axes from the current Element. The globally computed ranges can optionally override the extents.
The extents are computed by combining the data ranges, extents and dimension ranges. Each of these can be obtained individually by setting the range_type to one of:
‘data’: Just the data ranges
‘extents’: Element.extents
‘soft’: Dimension.soft_range values
‘hard’: Dimension.range values
To obtain the combined range, which includes range padding the default may be used:
‘combined’: All the range types combined and padding applied
This allows Overlay plots to obtain each range and combine them appropriately for all the objects in the overlay.
If lims_as_soft_ranges is set to True, the xlim and ylim will be treated as soft ranges instead of the default case as hard ranges while computing the extents. This is used e.g. when apply_hard_bounds is True and xlim/ylim is set, in which case we limit the initial viewable range to xlim/ylim, but allow navigation up to the abs max between the data range and xlim/ylim.
- get_padding(obj, extents)[source]#
Computes padding along the axes taking into account the plot aspect.
- get_zorder(overlay, key, el)[source]#
Computes the z-order of element in the NdOverlay taking into account possible batching of elements.
- init_artists(ax, plot_args, plot_kwargs)[source]#
Initializes the artist based on the plot method declared on the plot.
- refresh(**kwargs)[source]#
Refreshes the plot by rerendering it and then pushing the updated data if the plot has an associated Comm.
- size_fn = <ufunc 'absolute'>#
- property state#
The plotting state that gets updated via the update method and used by the renderer to generate output.
- teardown_handles()[source]#
If no custom update_handles method is supplied this method is called to tear down any previous handles before replacing them.
- traverse(fn=None, specs=None, full_breadth=True)[source]#
Traverses any nested DimensionedPlot returning a list of all plots that match the specs. The specs should be supplied as a list of either Plot types or callables, which should return a boolean given the plot class.
- update(key)[source]#
Update the internal state of the Plot to represent the given key tuple (where integers represent frames). Returns this state.
- class holoviews.plotting.mpl.chart.SideAreaPlot(element, **params)[source]#
Bases:
AdjoinedPlot,AreaPlotParameters inherited from:
holoviews.plotting.plot.DimensionedPlot: fontsize, fontscale, title, normalizeholoviews.plotting.mpl.plot.MPLPlot: projection, backend_opts, fig_alpha, fig_bounds, fig_inches, fig_latex, fig_rcparams, fig_size, initial_hooks, sublabel_format, sublabel_position, sublabel_size, show_frameholoviews.plotting.plot.GenericElementPlot: apply_ranges, apply_extents, default_span, hooks, invert_axes, invert_xaxis, invert_yaxis, logx, logy, show_grid, xlabel, ylabel, xlim, ylim, zlim, xrotation, yrotation, xticks, yticksholoviews.plotting.mpl.element.ElementPlot: apply_ticks, data_aspect, invert_zaxis, labelled, logz, xformatter, yformatter, zformatter, zaxis, zlabel, zrotation, zticksholoviews.plotting.mpl.chart.AreaPlot: padding, show_legendholoviews.plotting.mpl.plot.AdjoinedPlot: show_title, aspect, subplot_size, show_xlabelbgcolor= param.Parameter(allow_refs=False, default=(1, 1, 1, 0), label=’Bgcolor’, nested_refs=False, rx=<param.reactive.reactive_ops object at 0x7f6aeda3fa90>)Make plot background invisible.
xaxis= param.ObjectSelector(allow_refs=False, default=’bare’, label=’Xaxis’, names={}, nested_refs=False, objects=[‘top’, ‘bottom’, ‘bare’, ‘top-bare’, ‘bottom-bare’, None], rx=<param.reactive.reactive_ops object at 0x7f6aeda62c90>)Whether and where to display the xaxis, bare options allow suppressing all axis labels including ticks and xlabel. Valid options are ‘top’, ‘bottom’, ‘bare’, ‘top-bare’ and ‘bottom-bare’.
yaxis= param.ObjectSelector(allow_refs=False, default=’bare’, label=’Yaxis’, names={}, nested_refs=False, objects=[‘left’, ‘right’, ‘bare’, ‘left-bare’, ‘right-bare’, None], rx=<param.reactive.reactive_ops object at 0x7f6aeda62f90>)Whether and where to display the yaxis, bare options allow suppressing all axis labels including ticks and ylabel. Valid options are ‘left’, ‘right’, ‘bare’ ‘left-bare’ and ‘right-bare’.
border_size= param.Number(allow_refs=False, default=0, inclusive_bounds=(True, True), label=’Border size’, nested_refs=False, rx=<param.reactive.reactive_ops object at 0x7f6aeda63190>)The size of the border expressed as a fraction of the main plot.
- anim(start=0, stop=None, fps=30)[source]#
Method to return a matplotlib animation. The start and stop frames may be specified as well as the fps.
- compute_ranges(obj, key, ranges)[source]#
Given an object, a specific key, and the normalization options, this method will find the specified normalization options on the appropriate OptionTree, group the elements according to the selected normalization option (i.e. either per frame or over the whole animation) and finally compute the dimension ranges in each group. The new set of ranges is returned.
- get_extents(element, ranges, range_type='combined', **kwargs)[source]#
Gets the extents for the axes from the current Element. The globally computed ranges can optionally override the extents.
The extents are computed by combining the data ranges, extents and dimension ranges. Each of these can be obtained individually by setting the range_type to one of:
‘data’: Just the data ranges
‘extents’: Element.extents
‘soft’: Dimension.soft_range values
‘hard’: Dimension.range values
To obtain the combined range, which includes range padding the default may be used:
‘combined’: All the range types combined and padding applied
This allows Overlay plots to obtain each range and combine them appropriately for all the objects in the overlay.
If lims_as_soft_ranges is set to True, the xlim and ylim will be treated as soft ranges instead of the default case as hard ranges while computing the extents. This is used e.g. when apply_hard_bounds is True and xlim/ylim is set, in which case we limit the initial viewable range to xlim/ylim, but allow navigation up to the abs max between the data range and xlim/ylim.
- get_padding(obj, extents)[source]#
Computes padding along the axes taking into account the plot aspect.
- get_zorder(overlay, key, el)[source]#
Computes the z-order of element in the NdOverlay taking into account possible batching of elements.
- init_artists(ax, plot_data, plot_kwargs)[source]#
Initializes the artist based on the plot method declared on the plot.
- refresh(**kwargs)[source]#
Refreshes the plot by rerendering it and then pushing the updated data if the plot has an associated Comm.
- property state#
The plotting state that gets updated via the update method and used by the renderer to generate output.
- teardown_handles()[source]#
If no custom update_handles method is supplied this method is called to tear down any previous handles before replacing them.
- traverse(fn=None, specs=None, full_breadth=True)[source]#
Traverses any nested DimensionedPlot returning a list of all plots that match the specs. The specs should be supplied as a list of either Plot types or callables, which should return a boolean given the plot class.
- update(key)[source]#
Update the internal state of the Plot to represent the given key tuple (where integers represent frames). Returns this state.
- class holoviews.plotting.mpl.chart.SideHistogramPlot(histograms, **params)[source]#
Bases:
AdjoinedPlot,HistogramPlotParameters inherited from:
holoviews.plotting.plot.DimensionedPlot: fontsize, fontscale, title, normalizeholoviews.plotting.mpl.plot.MPLPlot: projection, backend_opts, fig_alpha, fig_bounds, fig_inches, fig_latex, fig_rcparams, fig_size, initial_hooks, sublabel_format, sublabel_position, sublabel_size, show_frameholoviews.plotting.plot.GenericElementPlot: apply_ranges, apply_extents, default_span, hooks, invert_axes, invert_xaxis, invert_yaxis, logx, logy, padding, show_legend, xaxis, yaxis, xlabel, ylabel, xlim, ylim, zlim, xrotation, yrotation, xticks, yticksholoviews.plotting.mpl.element.ElementPlot: apply_ticks, data_aspect, invert_zaxis, labelled, logz, xformatter, yformatter, zformatter, zaxis, zlabel, zrotation, zticksholoviews.plotting.mpl.element.ColorbarPlot: clabel, clim, clim_percentile, cformatter, colorbar, colorbar_opts, color_levels, cnorm, clipping_colors, cbar_padding, cbar_ticks, cbar_width, cbar_extend, rescale_discrete_levels, symmetricholoviews.plotting.mpl.plot.AdjoinedPlot: show_title, aspect, border_size, subplot_size, show_xlabelbgcolor= param.Parameter(allow_refs=False, default=(1, 1, 1, 0), label=’Bgcolor’, nested_refs=False, rx=<param.reactive.reactive_ops object at 0x7f6aeda7a050>)Make plot background invisible.
show_grid= param.Boolean(allow_refs=False, default=False, label=’Show grid’, nested_refs=False, rx=<param.reactive.reactive_ops object at 0x7f6aeda7b690>)Whether to overlay a grid on the axis.
offset= param.Number(allow_refs=False, bounds=(0, 1), default=0.2, inclusive_bounds=(True, True), label=’Offset’, nested_refs=False, rx=<param.reactive.reactive_ops object at 0x7f6aeda7bb90>)Histogram value offset for a colorbar.
- anim(start=0, stop=None, fps=30)[source]#
Method to return a matplotlib animation. The start and stop frames may be specified as well as the fps.
- compute_ranges(obj, key, ranges)[source]#
Given an object, a specific key, and the normalization options, this method will find the specified normalization options on the appropriate OptionTree, group the elements according to the selected normalization option (i.e. either per frame or over the whole animation) and finally compute the dimension ranges in each group. The new set of ranges is returned.
- get_extents(element, ranges, range_type='combined', **kwargs)[source]#
Gets the extents for the axes from the current Element. The globally computed ranges can optionally override the extents.
The extents are computed by combining the data ranges, extents and dimension ranges. Each of these can be obtained individually by setting the range_type to one of:
‘data’: Just the data ranges
‘extents’: Element.extents
‘soft’: Dimension.soft_range values
‘hard’: Dimension.range values
To obtain the combined range, which includes range padding the default may be used:
‘combined’: All the range types combined and padding applied
This allows Overlay plots to obtain each range and combine them appropriately for all the objects in the overlay.
If lims_as_soft_ranges is set to True, the xlim and ylim will be treated as soft ranges instead of the default case as hard ranges while computing the extents. This is used e.g. when apply_hard_bounds is True and xlim/ylim is set, in which case we limit the initial viewable range to xlim/ylim, but allow navigation up to the abs max between the data range and xlim/ylim.
- get_padding(obj, extents)[source]#
Computes padding along the axes taking into account the plot aspect.
- get_zorder(overlay, key, el)[source]#
Computes the z-order of element in the NdOverlay taking into account possible batching of elements.
- init_artists(ax, plot_args, plot_kwargs)[source]#
Initializes the artist based on the plot method declared on the plot.
- refresh(**kwargs)[source]#
Refreshes the plot by rerendering it and then pushing the updated data if the plot has an associated Comm.
- property state#
The plotting state that gets updated via the update method and used by the renderer to generate output.
- teardown_handles()[source]#
If no custom update_handles method is supplied this method is called to tear down any previous handles before replacing them.
- traverse(fn=None, specs=None, full_breadth=True)[source]#
Traverses any nested DimensionedPlot returning a list of all plots that match the specs. The specs should be supplied as a list of either Plot types or callables, which should return a boolean given the plot class.
- update(key)[source]#
Update the internal state of the Plot to represent the given key tuple (where integers represent frames). Returns this state.
- class holoviews.plotting.mpl.chart.SideSpikesPlot(*args, **kwargs)[source]#
Bases:
AdjoinedPlot,SpikesPlotParameters inherited from:
holoviews.plotting.plot.DimensionedPlot: fontsize, fontscale, title, normalizeholoviews.plotting.mpl.plot.MPLPlot: projection, backend_opts, fig_alpha, fig_bounds, fig_inches, fig_latex, fig_rcparams, fig_size, initial_hooks, sublabel_format, sublabel_position, sublabel_sizeholoviews.plotting.plot.GenericElementPlot: apply_ranges, apply_extents, default_span, hooks, invert_axes, invert_xaxis, invert_yaxis, logx, logy, show_grid, xlabel, ylabel, xlim, ylim, zlim, xrotation, yrotation, xticks, yticksholoviews.plotting.mpl.element.ElementPlot: apply_ticks, data_aspect, invert_zaxis, labelled, logz, xformatter, yformatter, zformatter, zaxis, zlabel, zrotation, zticksholoviews.plotting.mpl.element.ColorbarPlot: clabel, clim, clim_percentile, cformatter, colorbar, colorbar_opts, color_levels, cnorm, clipping_colors, cbar_padding, cbar_ticks, cbar_width, cbar_extend, rescale_discrete_levels, symmetricholoviews.plotting.mpl.path.PathPlot: show_legendholoviews.plotting.mpl.chart.SpikesPlot: padding, color_index, positionholoviews.plotting.mpl.plot.AdjoinedPlot: show_title, aspect, show_xlabelshow_frame= param.Boolean(allow_refs=False, default=True, label=’Show frame’, nested_refs=False, rx=<param.reactive.reactive_ops object at 0x7f6aed892dd0>)Whether or not to show a complete frame around the plot.
bgcolor= param.Parameter(allow_refs=False, default=(1, 1, 1, 0), label=’Bgcolor’, nested_refs=False, rx=<param.reactive.reactive_ops object at 0x7f6aed898510>)Make plot background invisible.
xaxis= param.ObjectSelector(allow_refs=False, default=’bare’, label=’Xaxis’, names={}, nested_refs=False, objects=[‘top’, ‘bottom’, ‘bare’, ‘top-bare’, ‘bottom-bare’, None], rx=<param.reactive.reactive_ops object at 0x7f6aed898810>)Whether and where to display the xaxis, bare options allow suppressing all axis labels including ticks and xlabel. Valid options are ‘top’, ‘bottom’, ‘bare’, ‘top-bare’ and ‘bottom-bare’.
yaxis= param.ObjectSelector(allow_refs=False, default=’bare’, label=’Yaxis’, names={}, nested_refs=False, objects=[‘left’, ‘right’, ‘bare’, ‘left-bare’, ‘right-bare’, None], rx=<param.reactive.reactive_ops object at 0x7f6aed898b10>)Whether and where to display the yaxis, bare options allow suppressing all axis labels including ticks and ylabel. Valid options are ‘left’, ‘right’, ‘bare’ ‘left-bare’ and ‘right-bare’.
spike_length= param.Number(allow_refs=False, default=1, inclusive_bounds=(True, True), label=’Spike length’, nested_refs=False, rx=<param.reactive.reactive_ops object at 0x7f6aed898d10>)The length of each spike if Spikes object is one dimensional.
border_size= param.Number(allow_refs=False, default=0, inclusive_bounds=(True, True), label=’Border size’, nested_refs=False, rx=<param.reactive.reactive_ops object at 0x7f6aed8990d0>)The size of the border expressed as a fraction of the main plot.
subplot_size= param.Number(allow_refs=False, default=0.1, inclusive_bounds=(True, True), label=’Subplot size’, nested_refs=False, rx=<param.reactive.reactive_ops object at 0x7f6aed898e50>)The size subplots as expressed as a fraction of the main plot.
- anim(start=0, stop=None, fps=30)[source]#
Method to return a matplotlib animation. The start and stop frames may be specified as well as the fps.
- compute_ranges(obj, key, ranges)[source]#
Given an object, a specific key, and the normalization options, this method will find the specified normalization options on the appropriate OptionTree, group the elements according to the selected normalization option (i.e. either per frame or over the whole animation) and finally compute the dimension ranges in each group. The new set of ranges is returned.
- get_extents(element, ranges, range_type='combined', **kwargs)[source]#
Gets the extents for the axes from the current Element. The globally computed ranges can optionally override the extents.
The extents are computed by combining the data ranges, extents and dimension ranges. Each of these can be obtained individually by setting the range_type to one of:
‘data’: Just the data ranges
‘extents’: Element.extents
‘soft’: Dimension.soft_range values
‘hard’: Dimension.range values
To obtain the combined range, which includes range padding the default may be used:
‘combined’: All the range types combined and padding applied
This allows Overlay plots to obtain each range and combine them appropriately for all the objects in the overlay.
If lims_as_soft_ranges is set to True, the xlim and ylim will be treated as soft ranges instead of the default case as hard ranges while computing the extents. This is used e.g. when apply_hard_bounds is True and xlim/ylim is set, in which case we limit the initial viewable range to xlim/ylim, but allow navigation up to the abs max between the data range and xlim/ylim.
- get_padding(obj, extents)[source]#
Computes padding along the axes taking into account the plot aspect.
- get_zorder(overlay, key, el)[source]#
Computes the z-order of element in the NdOverlay taking into account possible batching of elements.
- init_artists(ax, plot_args, plot_kwargs)[source]#
Initializes the artist based on the plot method declared on the plot.
- refresh(**kwargs)[source]#
Refreshes the plot by rerendering it and then pushing the updated data if the plot has an associated Comm.
- property state#
The plotting state that gets updated via the update method and used by the renderer to generate output.
- teardown_handles()[source]#
If no custom update_handles method is supplied this method is called to tear down any previous handles before replacing them.
- traverse(fn=None, specs=None, full_breadth=True)[source]#
Traverses any nested DimensionedPlot returning a list of all plots that match the specs. The specs should be supplied as a list of either Plot types or callables, which should return a boolean given the plot class.
- update(key)[source]#
Update the internal state of the Plot to represent the given key tuple (where integers represent frames). Returns this state.
- class holoviews.plotting.mpl.chart.SpikesPlot(*args, **kwargs)[source]#
Bases:
SpikesMixin,PathPlot,ColorbarPlotParameters inherited from:
holoviews.plotting.plot.DimensionedPlot: fontsize, fontscale, show_title, title, normalizeholoviews.plotting.mpl.plot.MPLPlot: projection, backend_opts, fig_alpha, fig_bounds, fig_inches, fig_latex, fig_rcparams, fig_size, initial_hooks, sublabel_format, sublabel_position, sublabel_size, show_frameholoviews.plotting.plot.GenericElementPlot: apply_ranges, apply_extents, bgcolor, default_span, hooks, invert_axes, invert_xaxis, invert_yaxis, logx, logy, show_grid, xaxis, yaxis, xlabel, ylabel, xlim, ylim, zlim, xrotation, yrotation, xticks, yticksholoviews.plotting.mpl.element.ElementPlot: apply_ticks, data_aspect, invert_zaxis, labelled, logz, xformatter, yformatter, zformatter, zaxis, zlabel, zrotation, zticksholoviews.plotting.mpl.element.ColorbarPlot: clabel, clim, clim_percentile, cformatter, colorbar, colorbar_opts, color_levels, cnorm, clipping_colors, cbar_padding, cbar_ticks, cbar_width, cbar_extend, rescale_discrete_levels, symmetricholoviews.plotting.mpl.path.PathPlot: show_legendpadding= param.ClassSelector(allow_refs=False, class_=(<class ‘int’>, <class ‘float’>, <class ‘tuple’>), default=(0, 0.1), label=’Padding’, nested_refs=False, rx=<param.reactive.reactive_ops object at 0x7f6aed8b0c10>)Fraction by which to increase auto-ranged extents to make datapoints more visible around borders. To compute padding, the axis whose screen size is largest is chosen, and the range of that axis is increased by the specified fraction along each axis. Other axes are then padded ensuring that the amount of screen space devoted to padding is equal for all axes. If specified as a tuple, the int or float values in the tuple will be used for padding in each axis, in order (x,y or x,y,z). For example, for padding=0.2 on a 800x800-pixel plot, an x-axis with the range [0,10] will be padded by 20% to be [-1,11], while a y-axis with a range [0,1000] will be padded to be [-100,1100], which should make the padding be approximately the same number of pixels. But if the same plot is changed to have a height of only 200, the y-range will then be [-400,1400] so that the y-axis padding will still match that of the x-axis. It is also possible to declare non-equal padding value for the lower and upper bound of an axis by supplying nested tuples, e.g. padding=(0.1, (0, 0.1)) will pad the x-axis lower and upper bound as well as the y-axis upper bound by a fraction of 0.1 while the y-axis lower bound is not padded at all.
aspect= param.Parameter(allow_refs=False, default=’square’, label=’Aspect’, nested_refs=False, rx=<param.reactive.reactive_ops object at 0x7f6aed8b2310>)The aspect ratio mode of the plot. Allows setting an explicit aspect ratio as width/height as well as ‘square’ and ‘equal’ options.
color_index= param.ClassSelector(allow_None=True, allow_refs=False, class_=(<class ‘str’>, <class ‘int’>), label=’Color index’, nested_refs=False, rx=<param.reactive.reactive_ops object at 0x7f6aed8b0b50>)Index of the dimension from which the color will the drawn
spike_length= param.Number(allow_refs=False, default=0.1, inclusive_bounds=(True, True), label=’Spike length’, nested_refs=False, rx=<param.reactive.reactive_ops object at 0x7f6aed8b2810>)The length of each spike if Spikes object is one dimensional.
position= param.Number(allow_refs=False, default=0.0, inclusive_bounds=(True, True), label=’Position’, nested_refs=False, rx=<param.reactive.reactive_ops object at 0x7f6aed8ad050>)The position of the lower end of each spike.
- anim(start=0, stop=None, fps=30)[source]#
Method to return a matplotlib animation. The start and stop frames may be specified as well as the fps.
- compute_ranges(obj, key, ranges)[source]#
Given an object, a specific key, and the normalization options, this method will find the specified normalization options on the appropriate OptionTree, group the elements according to the selected normalization option (i.e. either per frame or over the whole animation) and finally compute the dimension ranges in each group. The new set of ranges is returned.
- get_extents(element, ranges, range_type='combined', **kwargs)[source]#
Gets the extents for the axes from the current Element. The globally computed ranges can optionally override the extents.
The extents are computed by combining the data ranges, extents and dimension ranges. Each of these can be obtained individually by setting the range_type to one of:
‘data’: Just the data ranges
‘extents’: Element.extents
‘soft’: Dimension.soft_range values
‘hard’: Dimension.range values
To obtain the combined range, which includes range padding the default may be used:
‘combined’: All the range types combined and padding applied
This allows Overlay plots to obtain each range and combine them appropriately for all the objects in the overlay.
If lims_as_soft_ranges is set to True, the xlim and ylim will be treated as soft ranges instead of the default case as hard ranges while computing the extents. This is used e.g. when apply_hard_bounds is True and xlim/ylim is set, in which case we limit the initial viewable range to xlim/ylim, but allow navigation up to the abs max between the data range and xlim/ylim.
- get_padding(obj, extents)[source]#
Computes padding along the axes taking into account the plot aspect.
- get_zorder(overlay, key, el)[source]#
Computes the z-order of element in the NdOverlay taking into account possible batching of elements.
- init_artists(ax, plot_args, plot_kwargs)[source]#
Initializes the artist based on the plot method declared on the plot.
- refresh(**kwargs)[source]#
Refreshes the plot by rerendering it and then pushing the updated data if the plot has an associated Comm.
- property state#
The plotting state that gets updated via the update method and used by the renderer to generate output.
- teardown_handles()[source]#
If no custom update_handles method is supplied this method is called to tear down any previous handles before replacing them.
- traverse(fn=None, specs=None, full_breadth=True)[source]#
Traverses any nested DimensionedPlot returning a list of all plots that match the specs. The specs should be supplied as a list of either Plot types or callables, which should return a boolean given the plot class.
- update(key)[source]#
Update the internal state of the Plot to represent the given key tuple (where integers represent frames). Returns this state.
- class holoviews.plotting.mpl.chart.SpreadPlot(element, **params)[source]#
Bases:
AreaPlotSpreadPlot plots the Spread Element type.
Parameters inherited from:
holoviews.plotting.plot.DimensionedPlot: fontsize, fontscale, show_title, title, normalizeholoviews.plotting.mpl.plot.MPLPlot: projection, backend_opts, fig_alpha, fig_bounds, fig_inches, fig_latex, fig_rcparams, fig_size, initial_hooks, sublabel_format, sublabel_position, sublabel_size, show_frameholoviews.plotting.plot.GenericElementPlot: apply_ranges, apply_extents, bgcolor, default_span, hooks, invert_axes, invert_xaxis, invert_yaxis, logx, logy, show_grid, xaxis, yaxis, xlabel, ylabel, xlim, ylim, zlim, xrotation, yrotation, xticks, yticksholoviews.plotting.mpl.element.ElementPlot: apply_ticks, aspect, data_aspect, invert_zaxis, labelled, logz, xformatter, yformatter, zformatter, zaxis, zlabel, zrotation, ztickspadding= param.ClassSelector(allow_refs=False, class_=(<class ‘int’>, <class ‘float’>, <class ‘tuple’>), default=(0, 0.1), label=’Padding’, nested_refs=False, rx=<param.reactive.reactive_ops object at 0x7f6aed8d6210>)Fraction by which to increase auto-ranged extents to make datapoints more visible around borders. To compute padding, the axis whose screen size is largest is chosen, and the range of that axis is increased by the specified fraction along each axis. Other axes are then padded ensuring that the amount of screen space devoted to padding is equal for all axes. If specified as a tuple, the int or float values in the tuple will be used for padding in each axis, in order (x,y or x,y,z). For example, for padding=0.2 on a 800x800-pixel plot, an x-axis with the range [0,10] will be padded by 20% to be [-1,11], while a y-axis with a range [0,1000] will be padded to be [-100,1100], which should make the padding be approximately the same number of pixels. But if the same plot is changed to have a height of only 200, the y-range will then be [-400,1400] so that the y-axis padding will still match that of the x-axis. It is also possible to declare non-equal padding value for the lower and upper bound of an axis by supplying nested tuples, e.g. padding=(0.1, (0, 0.1)) will pad the x-axis lower and upper bound as well as the y-axis upper bound by a fraction of 0.1 while the y-axis lower bound is not padded at all.
show_legend= param.Boolean(allow_refs=False, default=False, label=’Show legend’, nested_refs=False, rx=<param.reactive.reactive_ops object at 0x7f6aed8d78d0>)Whether to show legend for the plot.
- anim(start=0, stop=None, fps=30)[source]#
Method to return a matplotlib animation. The start and stop frames may be specified as well as the fps.
- compute_ranges(obj, key, ranges)[source]#
Given an object, a specific key, and the normalization options, this method will find the specified normalization options on the appropriate OptionTree, group the elements according to the selected normalization option (i.e. either per frame or over the whole animation) and finally compute the dimension ranges in each group. The new set of ranges is returned.
- get_extents(element, ranges, range_type='combined', **kwargs)[source]#
Gets the extents for the axes from the current Element. The globally computed ranges can optionally override the extents.
The extents are computed by combining the data ranges, extents and dimension ranges. Each of these can be obtained individually by setting the range_type to one of:
‘data’: Just the data ranges
‘extents’: Element.extents
‘soft’: Dimension.soft_range values
‘hard’: Dimension.range values
To obtain the combined range, which includes range padding the default may be used:
‘combined’: All the range types combined and padding applied
This allows Overlay plots to obtain each range and combine them appropriately for all the objects in the overlay.
If lims_as_soft_ranges is set to True, the xlim and ylim will be treated as soft ranges instead of the default case as hard ranges while computing the extents. This is used e.g. when apply_hard_bounds is True and xlim/ylim is set, in which case we limit the initial viewable range to xlim/ylim, but allow navigation up to the abs max between the data range and xlim/ylim.
- get_padding(obj, extents)[source]#
Computes padding along the axes taking into account the plot aspect.
- get_zorder(overlay, key, el)[source]#
Computes the z-order of element in the NdOverlay taking into account possible batching of elements.
- init_artists(ax, plot_data, plot_kwargs)[source]#
Initializes the artist based on the plot method declared on the plot.
- refresh(**kwargs)[source]#
Refreshes the plot by rerendering it and then pushing the updated data if the plot has an associated Comm.
- property state#
The plotting state that gets updated via the update method and used by the renderer to generate output.
- teardown_handles()[source]#
If no custom update_handles method is supplied this method is called to tear down any previous handles before replacing them.
- traverse(fn=None, specs=None, full_breadth=True)[source]#
Traverses any nested DimensionedPlot returning a list of all plots that match the specs. The specs should be supplied as a list of either Plot types or callables, which should return a boolean given the plot class.
- update(key)[source]#
Update the internal state of the Plot to represent the given key tuple (where integers represent frames). Returns this state.
- class holoviews.plotting.mpl.chart.VectorFieldPlot(*args, **kwargs)[source]#
Bases:
ColorbarPlotRenders vector fields in sheet coordinates. The vectors are expressed in polar coordinates and may be displayed according to angle alone (with some common, arbitrary arrow length) or may be true polar vectors.
The color or magnitude can be mapped onto any dimension using the color_index and size_index.
The length of the arrows is controlled by the ‘scale’ style option. The scaling of the arrows may also be controlled via the normalize_lengths and rescale_lengths plot option, which will normalize the lengths to a maximum of 1 and scale them according to the minimum distance respectively.
Parameters inherited from:
holoviews.plotting.plot.DimensionedPlot: fontsize, fontscale, show_title, title, normalizeholoviews.plotting.mpl.plot.MPLPlot: projection, backend_opts, fig_alpha, fig_bounds, fig_inches, fig_latex, fig_rcparams, fig_size, initial_hooks, sublabel_format, sublabel_position, sublabel_size, show_frameholoviews.plotting.plot.GenericElementPlot: apply_ranges, apply_extents, bgcolor, default_span, hooks, invert_axes, invert_xaxis, invert_yaxis, logx, logy, show_legend, show_grid, xaxis, yaxis, xlabel, ylabel, xlim, ylim, zlim, xrotation, yrotation, xticks, yticksholoviews.plotting.mpl.element.ElementPlot: apply_ticks, aspect, data_aspect, invert_zaxis, labelled, logz, xformatter, yformatter, zformatter, zaxis, zlabel, zrotation, zticksholoviews.plotting.mpl.element.ColorbarPlot: clabel, clim, clim_percentile, cformatter, colorbar, colorbar_opts, color_levels, cnorm, clipping_colors, cbar_padding, cbar_ticks, cbar_width, cbar_extend, rescale_discrete_levels, symmetricpadding= param.ClassSelector(allow_refs=False, class_=(<class ‘int’>, <class ‘float’>, <class ‘tuple’>), default=0.05, label=’Padding’, nested_refs=False, rx=<param.reactive.reactive_ops object at 0x7f6aed8eb790>)Fraction by which to increase auto-ranged extents to make datapoints more visible around borders. To compute padding, the axis whose screen size is largest is chosen, and the range of that axis is increased by the specified fraction along each axis. Other axes are then padded ensuring that the amount of screen space devoted to padding is equal for all axes. If specified as a tuple, the int or float values in the tuple will be used for padding in each axis, in order (x,y or x,y,z). For example, for padding=0.2 on a 800x800-pixel plot, an x-axis with the range [0,10] will be padded by 20% to be [-1,11], while a y-axis with a range [0,1000] will be padded to be [-100,1100], which should make the padding be approximately the same number of pixels. But if the same plot is changed to have a height of only 200, the y-range will then be [-400,1400] so that the y-axis padding will still match that of the x-axis. It is also possible to declare non-equal padding value for the lower and upper bound of an axis by supplying nested tuples, e.g. padding=(0.1, (0, 0.1)) will pad the x-axis lower and upper bound as well as the y-axis upper bound by a fraction of 0.1 while the y-axis lower bound is not padded at all.
arrow_heads= param.Boolean(allow_refs=False, default=True, label=’Arrow heads’, nested_refs=False, rx=<param.reactive.reactive_ops object at 0x7f6aed8dced0>)Whether or not to draw arrow heads. If arrowheads are enabled, they may be customized with the ‘headlength’ and ‘headaxislength’ style options.
magnitude= param.ClassSelector(allow_None=True, allow_refs=False, class_=(<class ‘str’>, <class ‘holoviews.util.transform.dim’>), label=’Magnitude’, nested_refs=False, rx=<param.reactive.reactive_ops object at 0x7f6aed8eb6d0>)Dimension or dimension value transform that declares the magnitude of each vector. Magnitude is expected to be scaled between 0-1, by default the magnitudes are rescaled relative to the minimum distance between vectors, this can be disabled with the rescale_lengths option.
rescale_lengths= param.Boolean(allow_refs=False, default=True, label=’Rescale lengths’, nested_refs=False, rx=<param.reactive.reactive_ops object at 0x7f6aed8dcb90>)Whether the lengths will be rescaled to take into account the smallest non-zero distance between two vectors.
color_index= param.ClassSelector(allow_None=True, allow_refs=False, class_=(<class ‘str’>, <class ‘int’>), label=’Color index’, nested_refs=False, rx=<param.reactive.reactive_ops object at 0x7f6aed8eb6d0>)Deprecated in favor of dimension value transform on color option, e.g. color=dim(‘Magnitude’).
size_index= param.ClassSelector(allow_None=True, allow_refs=False, class_=(<class ‘str’>, <class ‘int’>), label=’Size index’, nested_refs=False, rx=<param.reactive.reactive_ops object at 0x7f6aed8dce50>)Deprecated in favor of the magnitude option, e.g. magnitude=dim(‘Magnitude’).
normalize_lengths= param.Boolean(allow_refs=False, default=True, label=’Normalize lengths’, nested_refs=False, rx=<param.reactive.reactive_ops object at 0x7f6aed8eb1d0>)Deprecated in favor of rescaling length using dimension value transforms using the magnitude option, e.g. dim(‘Magnitude’).norm().
- anim(start=0, stop=None, fps=30)[source]#
Method to return a matplotlib animation. The start and stop frames may be specified as well as the fps.
- compute_ranges(obj, key, ranges)[source]#
Given an object, a specific key, and the normalization options, this method will find the specified normalization options on the appropriate OptionTree, group the elements according to the selected normalization option (i.e. either per frame or over the whole animation) and finally compute the dimension ranges in each group. The new set of ranges is returned.
- get_extents(element, ranges, range_type='combined', dimension=None, xdim=None, ydim=None, zdim=None, lims_as_soft_ranges=False, **kwargs)[source]#
Gets the extents for the axes from the current Element. The globally computed ranges can optionally override the extents.
The extents are computed by combining the data ranges, extents and dimension ranges. Each of these can be obtained individually by setting the range_type to one of:
‘data’: Just the data ranges
‘extents’: Element.extents
‘soft’: Dimension.soft_range values
‘hard’: Dimension.range values
To obtain the combined range, which includes range padding the default may be used:
‘combined’: All the range types combined and padding applied
This allows Overlay plots to obtain each range and combine them appropriately for all the objects in the overlay.
If lims_as_soft_ranges is set to True, the xlim and ylim will be treated as soft ranges instead of the default case as hard ranges while computing the extents. This is used e.g. when apply_hard_bounds is True and xlim/ylim is set, in which case we limit the initial viewable range to xlim/ylim, but allow navigation up to the abs max between the data range and xlim/ylim.
- get_padding(obj, extents)[source]#
Computes padding along the axes taking into account the plot aspect.
- get_zorder(overlay, key, el)[source]#
Computes the z-order of element in the NdOverlay taking into account possible batching of elements.
- init_artists(ax, plot_args, plot_kwargs)[source]#
Initializes the artist based on the plot method declared on the plot.
- refresh(**kwargs)[source]#
Refreshes the plot by rerendering it and then pushing the updated data if the plot has an associated Comm.
- property state#
The plotting state that gets updated via the update method and used by the renderer to generate output.
- teardown_handles()[source]#
If no custom update_handles method is supplied this method is called to tear down any previous handles before replacing them.
- traverse(fn=None, specs=None, full_breadth=True)[source]#
Traverses any nested DimensionedPlot returning a list of all plots that match the specs. The specs should be supplied as a list of either Plot types or callables, which should return a boolean given the plot class.
- update(key)[source]#
Update the internal state of the Plot to represent the given key tuple (where integers represent frames). Returns this state.
chart3d Module#

- class holoviews.plotting.mpl.chart3d.Path3DPlot(*args, **kwargs)[source]#
-
Allows plotting paths on a 3D axis.
Parameters inherited from:
holoviews.plotting.plot.DimensionedPlot: fontsize, fontscale, show_title, title, normalizeholoviews.plotting.mpl.plot.MPLPlot: backend_opts, fig_alpha, fig_bounds, fig_inches, fig_latex, fig_rcparams, fig_size, initial_hooks, sublabel_format, sublabel_position, sublabel_size, show_frameholoviews.plotting.plot.GenericElementPlot: apply_ranges, apply_extents, default_span, hooks, invert_axes, invert_xaxis, invert_yaxis, logx, logy, padding, xlabel, ylabel, xlim, ylim, zlim, xrotation, yrotation, xticks, yticksholoviews.plotting.mpl.element.ElementPlot: apply_ticks, data_aspect, invert_zaxis, logz, xformatter, yformatter, zformatter, zlabel, zrotation, zticksholoviews.plotting.mpl.element.ColorbarPlot: clabel, clim, clim_percentile, cformatter, colorbar, colorbar_opts, color_levels, cnorm, clipping_colors, cbar_padding, cbar_ticks, cbar_width, cbar_extend, rescale_discrete_levels, symmetricholoviews.plotting.mpl.path.PathPlot: show_legend, aspect, color_indexholoviews.plotting.mpl.chart3d.Plot3D: projection, bgcolor, show_grid, xaxis, yaxis, labelled, zaxis, azimuth, elevation, distance, disable_axes- anim(start=0, stop=None, fps=30)[source]#
Method to return a matplotlib animation. The start and stop frames may be specified as well as the fps.
- compute_ranges(obj, key, ranges)[source]#
Given an object, a specific key, and the normalization options, this method will find the specified normalization options on the appropriate OptionTree, group the elements according to the selected normalization option (i.e. either per frame or over the whole animation) and finally compute the dimension ranges in each group. The new set of ranges is returned.
- get_extents(element, ranges, range_type='combined', dimension=None, xdim=None, ydim=None, zdim=None, lims_as_soft_ranges=False, **kwargs)[source]#
Gets the extents for the axes from the current Element. The globally computed ranges can optionally override the extents.
The extents are computed by combining the data ranges, extents and dimension ranges. Each of these can be obtained individually by setting the range_type to one of:
‘data’: Just the data ranges
‘extents’: Element.extents
‘soft’: Dimension.soft_range values
‘hard’: Dimension.range values
To obtain the combined range, which includes range padding the default may be used:
‘combined’: All the range types combined and padding applied
This allows Overlay plots to obtain each range and combine them appropriately for all the objects in the overlay.
If lims_as_soft_ranges is set to True, the xlim and ylim will be treated as soft ranges instead of the default case as hard ranges while computing the extents. This is used e.g. when apply_hard_bounds is True and xlim/ylim is set, in which case we limit the initial viewable range to xlim/ylim, but allow navigation up to the abs max between the data range and xlim/ylim.
- get_padding(obj, extents)[source]#
Computes padding along the axes taking into account the plot aspect.
- get_zorder(overlay, key, el)[source]#
Computes the z-order of element in the NdOverlay taking into account possible batching of elements.
- init_artists(ax, plot_args, plot_kwargs)[source]#
Initializes the artist based on the plot method declared on the plot.
- refresh(**kwargs)[source]#
Refreshes the plot by rerendering it and then pushing the updated data if the plot has an associated Comm.
- property state#
The plotting state that gets updated via the update method and used by the renderer to generate output.
- teardown_handles()[source]#
If no custom update_handles method is supplied this method is called to tear down any previous handles before replacing them.
- traverse(fn=None, specs=None, full_breadth=True)[source]#
Traverses any nested DimensionedPlot returning a list of all plots that match the specs. The specs should be supplied as a list of either Plot types or callables, which should return a boolean given the plot class.
- update(key)[source]#
Update the internal state of the Plot to represent the given key tuple (where integers represent frames). Returns this state.
- class holoviews.plotting.mpl.chart3d.Plot3D(*args, **kwargs)[source]#
Bases:
ColorbarPlotPlot3D provides a common baseclass for mplot3d based plots.
Parameters inherited from:
holoviews.plotting.plot.DimensionedPlot: fontsize, fontscale, show_title, title, normalizeholoviews.plotting.mpl.plot.MPLPlot: backend_opts, fig_alpha, fig_bounds, fig_inches, fig_latex, fig_rcparams, fig_size, initial_hooks, sublabel_format, sublabel_position, sublabel_size, show_frameholoviews.plotting.plot.GenericElementPlot: apply_ranges, apply_extents, default_span, hooks, invert_axes, invert_xaxis, invert_yaxis, logx, logy, padding, show_legend, xlabel, ylabel, xlim, ylim, zlim, xrotation, yrotation, xticks, yticksholoviews.plotting.mpl.element.ElementPlot: apply_ticks, aspect, data_aspect, invert_zaxis, logz, xformatter, yformatter, zformatter, zlabel, zrotation, zticksholoviews.plotting.mpl.element.ColorbarPlot: clabel, clim, clim_percentile, cformatter, colorbar, colorbar_opts, color_levels, cnorm, clipping_colors, cbar_padding, cbar_ticks, cbar_width, cbar_extend, rescale_discrete_levels, symmetricprojection= param.ObjectSelector(allow_refs=False, default=’3d’, label=’Projection’, names={}, nested_refs=False, objects=[‘3d’], rx=<param.reactive.reactive_ops object at 0x7f6aed29e110>)The projection of the matplotlib axis.
bgcolor= param.String(allow_refs=False, default=’white’, label=’Bgcolor’, nested_refs=False, rx=<param.reactive.reactive_ops object at 0x7f6aed29ec50>)Background color of the axis.
show_grid= param.Boolean(allow_refs=False, default=True, label=’Show grid’, nested_refs=False, rx=<param.reactive.reactive_ops object at 0x7f6aed29da90>)Whether to draw a grid in the figure.
xaxis= param.ObjectSelector(allow_refs=False, default=’fixed’, label=’Xaxis’, names={}, nested_refs=False, objects=[‘fixed’, None], rx=<param.reactive.reactive_ops object at 0x7f6aed29ecd0>)Whether and where to display the xaxis.
yaxis= param.ObjectSelector(allow_refs=False, default=’fixed’, label=’Yaxis’, names={}, nested_refs=False, objects=[‘fixed’, None], rx=<param.reactive.reactive_ops object at 0x7f6aed29ee90>)Whether and where to display the yaxis.
labelled= param.List(allow_refs=False, bounds=(0, None), default=[‘x’, ‘y’, ‘z’], label=’Labelled’, nested_refs=False, rx=<param.reactive.reactive_ops object at 0x7f6aed417850>)Whether to plot the ‘x’, ‘y’ and ‘z’ labels.
zaxis= param.ObjectSelector(allow_refs=False, default=’fixed’, label=’Zaxis’, names={}, nested_refs=False, objects=[‘fixed’, None], rx=<param.reactive.reactive_ops object at 0x7f6aed29de90>)Whether and where to display the yaxis.
azimuth= param.Integer(allow_refs=False, bounds=(-180, 180), default=-60, inclusive_bounds=(True, True), label=’Azimuth’, nested_refs=False, rx=<param.reactive.reactive_ops object at 0x7f6aedc17dd0>)Azimuth angle in the x,y plane.
elevation= param.Integer(allow_refs=False, bounds=(0, 180), default=30, inclusive_bounds=(True, True), label=’Elevation’, nested_refs=False, rx=<param.reactive.reactive_ops object at 0x7f6aed29f010>)Elevation angle in the z-axis.
distance= param.Integer(allow_refs=False, bounds=(7, 15), default=10, inclusive_bounds=(True, True), label=’Distance’, nested_refs=False, rx=<param.reactive.reactive_ops object at 0x7f6aed29e410>)Distance from the plotted object.
disable_axes= param.Boolean(allow_refs=False, default=False, label=’Disable axes’, nested_refs=False, rx=<param.reactive.reactive_ops object at 0x7f6aed29c050>)Disable all axes.
- anim(start=0, stop=None, fps=30)[source]#
Method to return a matplotlib animation. The start and stop frames may be specified as well as the fps.
- compute_ranges(obj, key, ranges)[source]#
Given an object, a specific key, and the normalization options, this method will find the specified normalization options on the appropriate OptionTree, group the elements according to the selected normalization option (i.e. either per frame or over the whole animation) and finally compute the dimension ranges in each group. The new set of ranges is returned.
- get_extents(element, ranges, range_type='combined', dimension=None, xdim=None, ydim=None, zdim=None, lims_as_soft_ranges=False, **kwargs)[source]#
Gets the extents for the axes from the current Element. The globally computed ranges can optionally override the extents.
The extents are computed by combining the data ranges, extents and dimension ranges. Each of these can be obtained individually by setting the range_type to one of:
‘data’: Just the data ranges
‘extents’: Element.extents
‘soft’: Dimension.soft_range values
‘hard’: Dimension.range values
To obtain the combined range, which includes range padding the default may be used:
‘combined’: All the range types combined and padding applied
This allows Overlay plots to obtain each range and combine them appropriately for all the objects in the overlay.
If lims_as_soft_ranges is set to True, the xlim and ylim will be treated as soft ranges instead of the default case as hard ranges while computing the extents. This is used e.g. when apply_hard_bounds is True and xlim/ylim is set, in which case we limit the initial viewable range to xlim/ylim, but allow navigation up to the abs max between the data range and xlim/ylim.
- get_padding(obj, extents)[source]#
Computes padding along the axes taking into account the plot aspect.
- get_zorder(overlay, key, el)[source]#
Computes the z-order of element in the NdOverlay taking into account possible batching of elements.
- init_artists(ax, plot_args, plot_kwargs)[source]#
Initializes the artist based on the plot method declared on the plot.
- refresh(**kwargs)[source]#
Refreshes the plot by rerendering it and then pushing the updated data if the plot has an associated Comm.
- property state#
The plotting state that gets updated via the update method and used by the renderer to generate output.
- teardown_handles()[source]#
If no custom update_handles method is supplied this method is called to tear down any previous handles before replacing them.
- traverse(fn=None, specs=None, full_breadth=True)[source]#
Traverses any nested DimensionedPlot returning a list of all plots that match the specs. The specs should be supplied as a list of either Plot types or callables, which should return a boolean given the plot class.
- update(key)[source]#
Update the internal state of the Plot to represent the given key tuple (where integers represent frames). Returns this state.
- class holoviews.plotting.mpl.chart3d.Scatter3DPlot(*args, **kwargs)[source]#
-
Subclass of PointPlot allowing plotting of Points on a 3D axis, also allows mapping color and size onto a particular Dimension of the data.
Parameters inherited from:
holoviews.plotting.plot.DimensionedPlot: fontsize, fontscale, show_title, title, normalizeholoviews.plotting.mpl.plot.MPLPlot: backend_opts, fig_alpha, fig_bounds, fig_inches, fig_latex, fig_rcparams, fig_size, initial_hooks, sublabel_format, sublabel_position, sublabel_size, show_frameholoviews.plotting.plot.GenericElementPlot: apply_ranges, apply_extents, default_span, hooks, invert_axes, invert_xaxis, invert_yaxis, logx, logy, padding, xlabel, ylabel, xlim, ylim, zlim, xrotation, yrotation, xticks, yticksholoviews.plotting.mpl.element.ElementPlot: apply_ticks, aspect, data_aspect, invert_zaxis, logz, xformatter, yformatter, zformatter, zlabel, zrotation, zticksholoviews.plotting.mpl.element.LegendPlot: show_legend, legend_cols, legend_labels, legend_position, legend_optsholoviews.plotting.mpl.element.ColorbarPlot: clabel, clim, clim_percentile, cformatter, colorbar, colorbar_opts, color_levels, cnorm, clipping_colors, cbar_padding, cbar_ticks, cbar_width, cbar_extend, rescale_discrete_levels, symmetricholoviews.plotting.mpl.chart.PointPlot: scaling_method, scaling_factor, size_fnholoviews.plotting.mpl.chart3d.Plot3D: projection, bgcolor, show_grid, xaxis, yaxis, labelled, zaxis, azimuth, elevation, distance, disable_axescolor_index= param.ClassSelector(allow_None=True, allow_refs=False, class_=(<class ‘str’>, <class ‘int’>), label=’Color index’, nested_refs=False, rx=<param.reactive.reactive_ops object at 0x7f6aed2bacd0>)Index of the dimension from which the color will the drawn
size_index= param.ClassSelector(allow_None=True, allow_refs=False, class_=(<class ‘str’>, <class ‘int’>), label=’Size index’, nested_refs=False, rx=<param.reactive.reactive_ops object at 0x7f6aed2c8650>)Index of the dimension from which the sizes will the drawn.
- anim(start=0, stop=None, fps=30)[source]#
Method to return a matplotlib animation. The start and stop frames may be specified as well as the fps.
- compute_ranges(obj, key, ranges)[source]#
Given an object, a specific key, and the normalization options, this method will find the specified normalization options on the appropriate OptionTree, group the elements according to the selected normalization option (i.e. either per frame or over the whole animation) and finally compute the dimension ranges in each group. The new set of ranges is returned.
- get_extents(element, ranges, range_type='combined', dimension=None, xdim=None, ydim=None, zdim=None, lims_as_soft_ranges=False, **kwargs)[source]#
Gets the extents for the axes from the current Element. The globally computed ranges can optionally override the extents.
The extents are computed by combining the data ranges, extents and dimension ranges. Each of these can be obtained individually by setting the range_type to one of:
‘data’: Just the data ranges
‘extents’: Element.extents
‘soft’: Dimension.soft_range values
‘hard’: Dimension.range values
To obtain the combined range, which includes range padding the default may be used:
‘combined’: All the range types combined and padding applied
This allows Overlay plots to obtain each range and combine them appropriately for all the objects in the overlay.
If lims_as_soft_ranges is set to True, the xlim and ylim will be treated as soft ranges instead of the default case as hard ranges while computing the extents. This is used e.g. when apply_hard_bounds is True and xlim/ylim is set, in which case we limit the initial viewable range to xlim/ylim, but allow navigation up to the abs max between the data range and xlim/ylim.
- get_padding(obj, extents)[source]#
Computes padding along the axes taking into account the plot aspect.
- get_zorder(overlay, key, el)[source]#
Computes the z-order of element in the NdOverlay taking into account possible batching of elements.
- init_artists(ax, plot_args, plot_kwargs)[source]#
Initializes the artist based on the plot method declared on the plot.
- refresh(**kwargs)[source]#
Refreshes the plot by rerendering it and then pushing the updated data if the plot has an associated Comm.
- size_fn = <ufunc 'absolute'>#
- property state#
The plotting state that gets updated via the update method and used by the renderer to generate output.
- teardown_handles()[source]#
If no custom update_handles method is supplied this method is called to tear down any previous handles before replacing them.
- traverse(fn=None, specs=None, full_breadth=True)[source]#
Traverses any nested DimensionedPlot returning a list of all plots that match the specs. The specs should be supplied as a list of either Plot types or callables, which should return a boolean given the plot class.
- update(key)[source]#
Update the internal state of the Plot to represent the given key tuple (where integers represent frames). Returns this state.
- class holoviews.plotting.mpl.chart3d.SurfacePlot(*args, **kwargs)[source]#
Bases:
Plot3DPlots surfaces wireframes and contours in 3D space. Provides options to switch the display type via the plot_type parameter has support for a number of styling options including strides and colors.
Parameters inherited from:
holoviews.plotting.plot.DimensionedPlot: fontsize, fontscale, show_title, title, normalizeholoviews.plotting.mpl.plot.MPLPlot: backend_opts, fig_alpha, fig_bounds, fig_inches, fig_latex, fig_rcparams, fig_size, initial_hooks, sublabel_format, sublabel_position, sublabel_size, show_frameholoviews.plotting.plot.GenericElementPlot: apply_ranges, apply_extents, default_span, hooks, invert_axes, invert_xaxis, invert_yaxis, logx, logy, padding, show_legend, xlabel, ylabel, xlim, ylim, zlim, xrotation, yrotation, xticks, yticksholoviews.plotting.mpl.element.ElementPlot: apply_ticks, aspect, data_aspect, invert_zaxis, logz, xformatter, yformatter, zformatter, zlabel, zrotation, zticksholoviews.plotting.mpl.element.ColorbarPlot: clabel, clim, clim_percentile, cformatter, colorbar_opts, color_levels, cnorm, clipping_colors, cbar_padding, cbar_ticks, cbar_width, cbar_extend, rescale_discrete_levels, symmetricholoviews.plotting.mpl.chart3d.Plot3D: projection, bgcolor, show_grid, xaxis, yaxis, labelled, zaxis, azimuth, elevation, distance, disable_axescolorbar= param.Boolean(allow_refs=False, default=False, label=’Colorbar’, nested_refs=False, rx=<param.reactive.reactive_ops object at 0x7f6aed2e6110>)Whether to add a colorbar to the plot.
plot_type= param.ObjectSelector(allow_refs=False, default=’surface’, label=’Plot type’, names={}, nested_refs=False, objects=[‘surface’, ‘wireframe’, ‘contour’], rx=<param.reactive.reactive_ops object at 0x7f6aed2e6ad0>)Specifies the type of visualization for the Surface object. Valid values are ‘surface’, ‘wireframe’ and ‘contour’.
- anim(start=0, stop=None, fps=30)[source]#
Method to return a matplotlib animation. The start and stop frames may be specified as well as the fps.
- compute_ranges(obj, key, ranges)[source]#
Given an object, a specific key, and the normalization options, this method will find the specified normalization options on the appropriate OptionTree, group the elements according to the selected normalization option (i.e. either per frame or over the whole animation) and finally compute the dimension ranges in each group. The new set of ranges is returned.
- get_extents(element, ranges, range_type='combined', dimension=None, xdim=None, ydim=None, zdim=None, lims_as_soft_ranges=False, **kwargs)[source]#
Gets the extents for the axes from the current Element. The globally computed ranges can optionally override the extents.
The extents are computed by combining the data ranges, extents and dimension ranges. Each of these can be obtained individually by setting the range_type to one of:
‘data’: Just the data ranges
‘extents’: Element.extents
‘soft’: Dimension.soft_range values
‘hard’: Dimension.range values
To obtain the combined range, which includes range padding the default may be used:
‘combined’: All the range types combined and padding applied
This allows Overlay plots to obtain each range and combine them appropriately for all the objects in the overlay.
If lims_as_soft_ranges is set to True, the xlim and ylim will be treated as soft ranges instead of the default case as hard ranges while computing the extents. This is used e.g. when apply_hard_bounds is True and xlim/ylim is set, in which case we limit the initial viewable range to xlim/ylim, but allow navigation up to the abs max between the data range and xlim/ylim.
- get_padding(obj, extents)[source]#
Computes padding along the axes taking into account the plot aspect.
- get_zorder(overlay, key, el)[source]#
Computes the z-order of element in the NdOverlay taking into account possible batching of elements.
- init_artists(ax, plot_data, plot_kwargs)[source]#
Initializes the artist based on the plot method declared on the plot.
- refresh(**kwargs)[source]#
Refreshes the plot by rerendering it and then pushing the updated data if the plot has an associated Comm.
- property state#
The plotting state that gets updated via the update method and used by the renderer to generate output.
- teardown_handles()[source]#
If no custom update_handles method is supplied this method is called to tear down any previous handles before replacing them.
- traverse(fn=None, specs=None, full_breadth=True)[source]#
Traverses any nested DimensionedPlot returning a list of all plots that match the specs. The specs should be supplied as a list of either Plot types or callables, which should return a boolean given the plot class.
- update(key)[source]#
Update the internal state of the Plot to represent the given key tuple (where integers represent frames). Returns this state.
- class holoviews.plotting.mpl.chart3d.TriSurfacePlot(*args, **kwargs)[source]#
Bases:
Plot3DPlots a trisurface given a TriSurface element, containing X, Y and Z coordinates.
Parameters inherited from:
holoviews.plotting.plot.DimensionedPlot: fontsize, fontscale, show_title, title, normalizeholoviews.plotting.mpl.plot.MPLPlot: backend_opts, fig_alpha, fig_bounds, fig_inches, fig_latex, fig_rcparams, fig_size, initial_hooks, sublabel_format, sublabel_position, sublabel_size, show_frameholoviews.plotting.plot.GenericElementPlot: apply_ranges, apply_extents, default_span, hooks, invert_axes, invert_xaxis, invert_yaxis, logx, logy, padding, show_legend, xlabel, ylabel, xlim, ylim, zlim, xrotation, yrotation, xticks, yticksholoviews.plotting.mpl.element.ElementPlot: apply_ticks, aspect, data_aspect, invert_zaxis, logz, xformatter, yformatter, zformatter, zlabel, zrotation, zticksholoviews.plotting.mpl.element.ColorbarPlot: clabel, clim, clim_percentile, cformatter, colorbar_opts, color_levels, cnorm, clipping_colors, cbar_padding, cbar_ticks, cbar_width, cbar_extend, rescale_discrete_levels, symmetricholoviews.plotting.mpl.chart3d.Plot3D: projection, bgcolor, show_grid, xaxis, yaxis, labelled, zaxis, azimuth, elevation, distance, disable_axescolorbar= param.Boolean(allow_refs=False, default=False, label=’Colorbar’, nested_refs=False, rx=<param.reactive.reactive_ops object at 0x7f6aed418410>)Whether to add a colorbar to the plot.
- anim(start=0, stop=None, fps=30)[source]#
Method to return a matplotlib animation. The start and stop frames may be specified as well as the fps.
- compute_ranges(obj, key, ranges)[source]#
Given an object, a specific key, and the normalization options, this method will find the specified normalization options on the appropriate OptionTree, group the elements according to the selected normalization option (i.e. either per frame or over the whole animation) and finally compute the dimension ranges in each group. The new set of ranges is returned.
- get_extents(element, ranges, range_type='combined', dimension=None, xdim=None, ydim=None, zdim=None, lims_as_soft_ranges=False, **kwargs)[source]#
Gets the extents for the axes from the current Element. The globally computed ranges can optionally override the extents.
The extents are computed by combining the data ranges, extents and dimension ranges. Each of these can be obtained individually by setting the range_type to one of:
‘data’: Just the data ranges
‘extents’: Element.extents
‘soft’: Dimension.soft_range values
‘hard’: Dimension.range values
To obtain the combined range, which includes range padding the default may be used:
‘combined’: All the range types combined and padding applied
This allows Overlay plots to obtain each range and combine them appropriately for all the objects in the overlay.
If lims_as_soft_ranges is set to True, the xlim and ylim will be treated as soft ranges instead of the default case as hard ranges while computing the extents. This is used e.g. when apply_hard_bounds is True and xlim/ylim is set, in which case we limit the initial viewable range to xlim/ylim, but allow navigation up to the abs max between the data range and xlim/ylim.
- get_padding(obj, extents)[source]#
Computes padding along the axes taking into account the plot aspect.
- get_zorder(overlay, key, el)[source]#
Computes the z-order of element in the NdOverlay taking into account possible batching of elements.
- init_artists(ax, plot_args, plot_kwargs)[source]#
Initializes the artist based on the plot method declared on the plot.
- refresh(**kwargs)[source]#
Refreshes the plot by rerendering it and then pushing the updated data if the plot has an associated Comm.
- property state#
The plotting state that gets updated via the update method and used by the renderer to generate output.
- teardown_handles()[source]#
If no custom update_handles method is supplied this method is called to tear down any previous handles before replacing them.
- traverse(fn=None, specs=None, full_breadth=True)[source]#
Traverses any nested DimensionedPlot returning a list of all plots that match the specs. The specs should be supplied as a list of either Plot types or callables, which should return a boolean given the plot class.
- update(key)[source]#
Update the internal state of the Plot to represent the given key tuple (where integers represent frames). Returns this state.
element Module#

- class holoviews.plotting.mpl.element.ColorbarPlot(*args, **kwargs)[source]#
Bases:
ElementPlotParameters inherited from:
holoviews.plotting.plot.DimensionedPlot: fontsize, fontscale, show_title, title, normalizeholoviews.plotting.mpl.plot.MPLPlot: projection, backend_opts, fig_alpha, fig_bounds, fig_inches, fig_latex, fig_rcparams, fig_size, initial_hooks, sublabel_format, sublabel_position, sublabel_size, show_frameholoviews.plotting.plot.GenericElementPlot: apply_ranges, apply_extents, bgcolor, default_span, hooks, invert_axes, invert_xaxis, invert_yaxis, logx, logy, padding, show_legend, show_grid, xaxis, yaxis, xlabel, ylabel, xlim, ylim, zlim, xrotation, yrotation, xticks, yticksholoviews.plotting.mpl.element.ElementPlot: apply_ticks, aspect, data_aspect, invert_zaxis, labelled, logz, xformatter, yformatter, zformatter, zaxis, zlabel, zrotation, zticksclabel= param.String(allow_None=True, allow_refs=False, label=’Clabel’, nested_refs=False, rx=<param.reactive.reactive_ops object at 0x7f6aed10dbd0>)An explicit override of the color bar label, if set takes precedence over the title key in colorbar_opts.
clim= param.Tuple(allow_refs=False, default=(nan, nan), label=’Clim’, length=2, nested_refs=False, rx=<param.reactive.reactive_ops object at 0x7f6aed5e2d10>)User-specified colorbar axis range limits for the plot, as a tuple (low,high). If specified, takes precedence over data and dimension ranges.
clim_percentile= param.ClassSelector(allow_refs=False, class_=(<class ‘int’>, <class ‘float’>, <class ‘bool’>), default=False, label=’Clim percentile’, nested_refs=False, rx=<param.reactive.reactive_ops object at 0x7f6aed10dbd0>)Percentile value to compute colorscale robust to outliers. If True, uses 2nd and 98th percentile; otherwise uses the specified numerical percentile value.
cformatter= param.ClassSelector(allow_None=True, allow_refs=False, class_=(<class ‘str’>, <class ‘matplotlib.ticker.Formatter’>, <class ‘function’>), label=’Cformatter’, nested_refs=False, rx=<param.reactive.reactive_ops object at 0x7f6aed0c9d50>)Formatter for ticks along the colorbar axis.
colorbar= param.Boolean(allow_refs=False, default=False, label=’Colorbar’, nested_refs=False, rx=<param.reactive.reactive_ops object at 0x7f6aed10dc50>)Whether to draw a colorbar.
colorbar_opts= param.Dict(allow_refs=False, class_=<class ‘dict’>, default={}, label=’Colorbar opts’, nested_refs=False, rx=<param.reactive.reactive_ops object at 0x7f6aed0c9190>)Allows setting specific styling options for the colorbar.
color_levels= param.ClassSelector(allow_None=True, allow_refs=False, class_=(<class ‘int’>, <class ‘list’>), label=’Color levels’, nested_refs=False, rx=<param.reactive.reactive_ops object at 0x7f6aed10dbd0>)Number of discrete colors to use when colormapping or a set of color intervals defining the range of values to map each color to.
cnorm= param.ObjectSelector(allow_refs=False, default=’linear’, label=’Cnorm’, names={}, nested_refs=False, objects=[‘linear’, ‘log’, ‘eq_hist’], rx=<param.reactive.reactive_ops object at 0x7f6aed0c9cd0>)Color normalization to be applied during colormapping.
clipping_colors= param.Dict(allow_refs=False, class_=<class ‘dict’>, default={}, label=’Clipping colors’, nested_refs=False, rx=<param.reactive.reactive_ops object at 0x7f6aed10dbd0>)Dictionary to specify colors for clipped values, allows setting color for NaN values and for values above and below the min and max value. The min, max or NaN color may specify an RGB(A) color as a color hex string of the form #FFFFFF or #FFFFFFFF or a length 3 or length 4 tuple specifying values in the range 0-1 or a named HTML color.
cbar_padding= param.Number(allow_refs=False, default=0.01, inclusive_bounds=(True, True), label=’Cbar padding’, nested_refs=False, rx=<param.reactive.reactive_ops object at 0x7f6aed0c9010>)Padding between colorbar and other plots.
cbar_ticks= param.Parameter(allow_None=True, allow_refs=False, label=’Cbar ticks’, nested_refs=False, rx=<param.reactive.reactive_ops object at 0x7f6aed10e590>)Ticks along colorbar-axis specified as an integer, explicit list of tick locations, list of tuples containing the locations and labels or a matplotlib tick locator object. If set to None default matplotlib ticking behavior is applied.
cbar_width= param.Number(allow_refs=False, default=0.05, inclusive_bounds=(True, True), label=’Cbar width’, nested_refs=False, rx=<param.reactive.reactive_ops object at 0x7f6aed0c9190>)Width of the colorbar as a fraction of the main plot
cbar_extend= param.ObjectSelector(allow_refs=False, label=’Cbar extend’, names={}, nested_refs=False, objects=[‘neither’, ‘both’, ‘min’, ‘max’], rx=<param.reactive.reactive_ops object at 0x7f6aed0c9110>)If not ‘neither’, make pointed end(s) for out-of- range values.
rescale_discrete_levels= param.Boolean(allow_refs=False, default=True, label=’Rescale discrete levels’, nested_refs=False, rx=<param.reactive.reactive_ops object at 0x7f6aed10f210>)If
cnorm='eq_histand there are only a few discrete values, thenrescale_discrete_levels=Truedecreases the lower limit of the autoranged span so that the values are rendering towards the (more visible) top of the palette, thus avoiding washout of the lower values. Has no effect ifcnorm!=`eq_hist. Set this value to False if you need to match historical unscaled behavior, prior to HoloViews 1.14.4.symmetric= param.Boolean(allow_refs=False, default=False, label=’Symmetric’, nested_refs=False, rx=<param.reactive.reactive_ops object at 0x7f6aed10dc50>)Whether to make the colormap symmetric around zero.
- anim(start=0, stop=None, fps=30)[source]#
Method to return a matplotlib animation. The start and stop frames may be specified as well as the fps.
- compute_ranges(obj, key, ranges)[source]#
Given an object, a specific key, and the normalization options, this method will find the specified normalization options on the appropriate OptionTree, group the elements according to the selected normalization option (i.e. either per frame or over the whole animation) and finally compute the dimension ranges in each group. The new set of ranges is returned.
- get_extents(element, ranges, range_type='combined', dimension=None, xdim=None, ydim=None, zdim=None, lims_as_soft_ranges=False, **kwargs)[source]#
Gets the extents for the axes from the current Element. The globally computed ranges can optionally override the extents.
The extents are computed by combining the data ranges, extents and dimension ranges. Each of these can be obtained individually by setting the range_type to one of:
‘data’: Just the data ranges
‘extents’: Element.extents
‘soft’: Dimension.soft_range values
‘hard’: Dimension.range values
To obtain the combined range, which includes range padding the default may be used:
‘combined’: All the range types combined and padding applied
This allows Overlay plots to obtain each range and combine them appropriately for all the objects in the overlay.
If lims_as_soft_ranges is set to True, the xlim and ylim will be treated as soft ranges instead of the default case as hard ranges while computing the extents. This is used e.g. when apply_hard_bounds is True and xlim/ylim is set, in which case we limit the initial viewable range to xlim/ylim, but allow navigation up to the abs max between the data range and xlim/ylim.
- get_padding(obj, extents)[source]#
Computes padding along the axes taking into account the plot aspect.
- get_zorder(overlay, key, el)[source]#
Computes the z-order of element in the NdOverlay taking into account possible batching of elements.
- init_artists(ax, plot_args, plot_kwargs)[source]#
Initializes the artist based on the plot method declared on the plot.
- refresh(**kwargs)[source]#
Refreshes the plot by rerendering it and then pushing the updated data if the plot has an associated Comm.
- property state#
The plotting state that gets updated via the update method and used by the renderer to generate output.
- teardown_handles()[source]#
If no custom update_handles method is supplied this method is called to tear down any previous handles before replacing them.
- traverse(fn=None, specs=None, full_breadth=True)[source]#
Traverses any nested DimensionedPlot returning a list of all plots that match the specs. The specs should be supplied as a list of either Plot types or callables, which should return a boolean given the plot class.
- update(key)[source]#
Update the internal state of the Plot to represent the given key tuple (where integers represent frames). Returns this state.
- class holoviews.plotting.mpl.element.ElementPlot(element, **params)[source]#
Bases:
GenericElementPlot,MPLPlotParameters inherited from:
holoviews.plotting.plot.DimensionedPlot: fontsize, fontscale, show_title, title, normalizeholoviews.plotting.mpl.plot.MPLPlot: projection, backend_opts, fig_alpha, fig_bounds, fig_inches, fig_latex, fig_rcparams, fig_size, initial_hooks, sublabel_format, sublabel_position, sublabel_size, show_frameholoviews.plotting.plot.GenericElementPlot: apply_ranges, apply_extents, bgcolor, default_span, hooks, invert_axes, invert_xaxis, invert_yaxis, logx, logy, padding, show_legend, show_grid, xaxis, yaxis, xlabel, ylabel, xlim, ylim, zlim, xrotation, yrotation, xticks, yticksapply_ticks= param.Boolean(allow_refs=False, default=True, label=’Apply ticks’, nested_refs=False, rx=<param.reactive.reactive_ops object at 0x7f6aed14e450>)Whether to apply custom ticks.
aspect= param.Parameter(allow_refs=False, default=’square’, label=’Aspect’, nested_refs=False, rx=<param.reactive.reactive_ops object at 0x7f6aecf6bbd0>)The aspect ratio mode of the plot. By default, a plot may select its own appropriate aspect ratio but sometimes it may be necessary to force a square aspect ratio (e.g. to display the plot as an element of a grid). The modes ‘auto’ and ‘equal’ correspond to the axis modes of the same name in matplotlib, a numeric value specifying the ratio between plot width and height may also be passed. To control the aspect ratio between the axis scales use the data_aspect option instead.
data_aspect= param.Number(allow_None=True, allow_refs=False, inclusive_bounds=(True, True), label=’Data aspect’, nested_refs=False, rx=<param.reactive.reactive_ops object at 0x7f6aecf6a8d0>)Defines the aspect of the axis scaling, i.e. the ratio of y-unit to x-unit.
invert_zaxis= param.Boolean(allow_refs=False, default=False, label=’Invert zaxis’, nested_refs=False, rx=<param.reactive.reactive_ops object at 0x7f6aecf68890>)Whether to invert the plot z-axis.
labelled= param.List(allow_refs=False, bounds=(0, None), default=[‘x’, ‘y’], label=’Labelled’, nested_refs=False, rx=<param.reactive.reactive_ops object at 0x7f6aed282e10>)Whether to plot the ‘x’ and ‘y’ labels.
logz= param.Boolean(allow_refs=False, default=False, label=’Logz’, nested_refs=False, rx=<param.reactive.reactive_ops object at 0x7f6aed14e110>)Whether to apply log scaling to the y-axis of the Chart.
xformatter= param.ClassSelector(allow_None=True, allow_refs=False, class_=(<class ‘str’>, <class ‘matplotlib.ticker.Formatter’>, <class ‘function’>), label=’Xformatter’, nested_refs=False, rx=<param.reactive.reactive_ops object at 0x7f6aed14fcd0>)Formatter for ticks along the x-axis.
yformatter= param.ClassSelector(allow_None=True, allow_refs=False, class_=(<class ‘str’>, <class ‘matplotlib.ticker.Formatter’>, <class ‘function’>), label=’Yformatter’, nested_refs=False, rx=<param.reactive.reactive_ops object at 0x7f6aecf68890>)Formatter for ticks along the y-axis.
zformatter= param.ClassSelector(allow_None=True, allow_refs=False, class_=(<class ‘str’>, <class ‘matplotlib.ticker.Formatter’>, <class ‘function’>), label=’Zformatter’, nested_refs=False, rx=<param.reactive.reactive_ops object at 0x7f6aed14fcd0>)Formatter for ticks along the z-axis.
zaxis= param.Boolean(allow_refs=False, default=True, label=’Zaxis’, nested_refs=False, rx=<param.reactive.reactive_ops object at 0x7f6aed14e110>)Whether to display the z-axis.
zlabel= param.String(allow_None=True, allow_refs=False, label=’Zlabel’, nested_refs=False, rx=<param.reactive.reactive_ops object at 0x7f6aed14fc50>)An explicit override of the z-axis label, if set takes precedence over the dimension label.
zrotation= param.Integer(allow_refs=False, bounds=(0, 360), default=0, inclusive_bounds=(True, True), label=’Zrotation’, nested_refs=False, rx=<param.reactive.reactive_ops object at 0x7f6aed11fd10>)Rotation angle of the zticks.
zticks= param.Parameter(allow_None=True, allow_refs=False, label=’Zticks’, nested_refs=False, rx=<param.reactive.reactive_ops object at 0x7f6aed14e8d0>)Ticks along z-axis specified as an integer, explicit list of tick locations, list of tuples containing the locations and labels or a matplotlib tick locator object. If set to None default matplotlib ticking behavior is applied.
- anim(start=0, stop=None, fps=30)[source]#
Method to return a matplotlib animation. The start and stop frames may be specified as well as the fps.
- compute_ranges(obj, key, ranges)[source]#
Given an object, a specific key, and the normalization options, this method will find the specified normalization options on the appropriate OptionTree, group the elements according to the selected normalization option (i.e. either per frame or over the whole animation) and finally compute the dimension ranges in each group. The new set of ranges is returned.
- get_extents(element, ranges, range_type='combined', dimension=None, xdim=None, ydim=None, zdim=None, lims_as_soft_ranges=False, **kwargs)[source]#
Gets the extents for the axes from the current Element. The globally computed ranges can optionally override the extents.
The extents are computed by combining the data ranges, extents and dimension ranges. Each of these can be obtained individually by setting the range_type to one of:
‘data’: Just the data ranges
‘extents’: Element.extents
‘soft’: Dimension.soft_range values
‘hard’: Dimension.range values
To obtain the combined range, which includes range padding the default may be used:
‘combined’: All the range types combined and padding applied
This allows Overlay plots to obtain each range and combine them appropriately for all the objects in the overlay.
If lims_as_soft_ranges is set to True, the xlim and ylim will be treated as soft ranges instead of the default case as hard ranges while computing the extents. This is used e.g. when apply_hard_bounds is True and xlim/ylim is set, in which case we limit the initial viewable range to xlim/ylim, but allow navigation up to the abs max between the data range and xlim/ylim.
- get_padding(obj, extents)[source]#
Computes padding along the axes taking into account the plot aspect.
- get_zorder(overlay, key, el)[source]#
Computes the z-order of element in the NdOverlay taking into account possible batching of elements.
- init_artists(ax, plot_args, plot_kwargs)[source]#
Initializes the artist based on the plot method declared on the plot.
- refresh(**kwargs)[source]#
Refreshes the plot by rerendering it and then pushing the updated data if the plot has an associated Comm.
- property state#
The plotting state that gets updated via the update method and used by the renderer to generate output.
- teardown_handles()[source]#
If no custom update_handles method is supplied this method is called to tear down any previous handles before replacing them.
- traverse(fn=None, specs=None, full_breadth=True)[source]#
Traverses any nested DimensionedPlot returning a list of all plots that match the specs. The specs should be supplied as a list of either Plot types or callables, which should return a boolean given the plot class.
- update(key)[source]#
Update the internal state of the Plot to represent the given key tuple (where integers represent frames). Returns this state.
- class holoviews.plotting.mpl.element.LegendPlot(element, **params)[source]#
Bases:
ElementPlotParameters inherited from:
holoviews.plotting.plot.DimensionedPlot: fontsize, fontscale, show_title, title, normalizeholoviews.plotting.mpl.plot.MPLPlot: projection, backend_opts, fig_alpha, fig_bounds, fig_inches, fig_latex, fig_rcparams, fig_size, initial_hooks, sublabel_format, sublabel_position, sublabel_size, show_frameholoviews.plotting.plot.GenericElementPlot: apply_ranges, apply_extents, bgcolor, default_span, hooks, invert_axes, invert_xaxis, invert_yaxis, logx, logy, padding, show_grid, xaxis, yaxis, xlabel, ylabel, xlim, ylim, zlim, xrotation, yrotation, xticks, yticksholoviews.plotting.mpl.element.ElementPlot: apply_ticks, aspect, data_aspect, invert_zaxis, labelled, logz, xformatter, yformatter, zformatter, zaxis, zlabel, zrotation, zticksshow_legend= param.Boolean(allow_refs=False, default=True, label=’Show legend’, nested_refs=False, rx=<param.reactive.reactive_ops object at 0x7f6aeced2050>)Whether to show legend for the plot.
legend_cols= param.Integer(allow_None=True, allow_refs=False, inclusive_bounds=(True, True), label=’Legend cols’, nested_refs=False, rx=<param.reactive.reactive_ops object at 0x7f6aeced0550>)Number of legend columns in the legend.
legend_labels= param.Dict(allow_refs=False, class_=<class ‘dict’>, default={}, label=’Legend labels’, nested_refs=False, rx=<param.reactive.reactive_ops object at 0x7f6aeced1450>)A mapping that allows overriding legend labels.
legend_position= param.ObjectSelector(allow_refs=False, default=’inner’, label=’Legend position’, names={}, nested_refs=False, objects=[‘inner’, ‘right’, ‘bottom’, ‘top’, ‘left’, ‘best’, ‘top_right’, ‘top_left’, ‘bottom_left’, ‘bottom_right’], rx=<param.reactive.reactive_ops object at 0x7f6aeced0490>)Allows selecting between a number of predefined legend position options. The predefined options may be customized in the legend_specs class attribute. By default, ‘inner’, ‘right’, ‘bottom’, ‘top’, ‘left’, ‘best’, ‘top_right’, ‘top_left’, ‘bottom_right’ and ‘bottom_left’ are supported.
legend_opts= param.Dict(allow_refs=False, class_=<class ‘dict’>, default={}, label=’Legend opts’, nested_refs=False, rx=<param.reactive.reactive_ops object at 0x7f6aeced1150>)Allows setting specific styling options for the colorbar.
- anim(start=0, stop=None, fps=30)[source]#
Method to return a matplotlib animation. The start and stop frames may be specified as well as the fps.
- compute_ranges(obj, key, ranges)[source]#
Given an object, a specific key, and the normalization options, this method will find the specified normalization options on the appropriate OptionTree, group the elements according to the selected normalization option (i.e. either per frame or over the whole animation) and finally compute the dimension ranges in each group. The new set of ranges is returned.
- get_extents(element, ranges, range_type='combined', dimension=None, xdim=None, ydim=None, zdim=None, lims_as_soft_ranges=False, **kwargs)[source]#
Gets the extents for the axes from the current Element. The globally computed ranges can optionally override the extents.
The extents are computed by combining the data ranges, extents and dimension ranges. Each of these can be obtained individually by setting the range_type to one of:
‘data’: Just the data ranges
‘extents’: Element.extents
‘soft’: Dimension.soft_range values
‘hard’: Dimension.range values
To obtain the combined range, which includes range padding the default may be used:
‘combined’: All the range types combined and padding applied
This allows Overlay plots to obtain each range and combine them appropriately for all the objects in the overlay.
If lims_as_soft_ranges is set to True, the xlim and ylim will be treated as soft ranges instead of the default case as hard ranges while computing the extents. This is used e.g. when apply_hard_bounds is True and xlim/ylim is set, in which case we limit the initial viewable range to xlim/ylim, but allow navigation up to the abs max between the data range and xlim/ylim.
- get_padding(obj, extents)[source]#
Computes padding along the axes taking into account the plot aspect.
- get_zorder(overlay, key, el)[source]#
Computes the z-order of element in the NdOverlay taking into account possible batching of elements.
- init_artists(ax, plot_args, plot_kwargs)[source]#
Initializes the artist based on the plot method declared on the plot.
- refresh(**kwargs)[source]#
Refreshes the plot by rerendering it and then pushing the updated data if the plot has an associated Comm.
- property state#
The plotting state that gets updated via the update method and used by the renderer to generate output.
- teardown_handles()[source]#
If no custom update_handles method is supplied this method is called to tear down any previous handles before replacing them.
- traverse(fn=None, specs=None, full_breadth=True)[source]#
Traverses any nested DimensionedPlot returning a list of all plots that match the specs. The specs should be supplied as a list of either Plot types or callables, which should return a boolean given the plot class.
- update(key)[source]#
Update the internal state of the Plot to represent the given key tuple (where integers represent frames). Returns this state.
- class holoviews.plotting.mpl.element.OverlayPlot(overlay, ranges=None, **params)[source]#
Bases:
LegendPlot,GenericOverlayPlotOverlayPlot supports compositors processing of Overlays across maps.
Parameters inherited from:
holoviews.plotting.plot.DimensionedPlot: fontsize, fontscale, show_title, title, normalizeholoviews.plotting.mpl.plot.MPLPlot: projection, backend_opts, fig_alpha, fig_bounds, fig_inches, fig_latex, fig_rcparams, fig_size, initial_hooks, sublabel_format, sublabel_position, sublabel_size, show_frameholoviews.plotting.plot.GenericElementPlot: apply_ranges, apply_extents, bgcolor, default_span, hooks, invert_axes, invert_xaxis, invert_yaxis, logx, logy, padding, show_grid, xaxis, yaxis, xlabel, ylabel, xlim, ylim, zlim, xrotation, yrotation, xticks, yticksholoviews.plotting.plot.GenericOverlayPlot: batched, legend_limit, style_groupingholoviews.plotting.mpl.element.ElementPlot: apply_ticks, aspect, data_aspect, invert_zaxis, labelled, logz, xformatter, yformatter, zformatter, zaxis, zlabel, zrotation, zticksholoviews.plotting.mpl.element.LegendPlot: show_legend, legend_cols, legend_labels, legend_position, legend_opts- anim(start=0, stop=None, fps=30)[source]#
Method to return a matplotlib animation. The start and stop frames may be specified as well as the fps.
- compute_ranges(obj, key, ranges)[source]#
Given an object, a specific key, and the normalization options, this method will find the specified normalization options on the appropriate OptionTree, group the elements according to the selected normalization option (i.e. either per frame or over the whole animation) and finally compute the dimension ranges in each group. The new set of ranges is returned.
- get_extents(overlay, ranges, range_type='combined', dimension=None, **kwargs)[source]#
Gets the extents for the axes from the current Element. The globally computed ranges can optionally override the extents.
The extents are computed by combining the data ranges, extents and dimension ranges. Each of these can be obtained individually by setting the range_type to one of:
‘data’: Just the data ranges
‘extents’: Element.extents
‘soft’: Dimension.soft_range values
‘hard’: Dimension.range values
To obtain the combined range, which includes range padding the default may be used:
‘combined’: All the range types combined and padding applied
This allows Overlay plots to obtain each range and combine them appropriately for all the objects in the overlay.
If lims_as_soft_ranges is set to True, the xlim and ylim will be treated as soft ranges instead of the default case as hard ranges while computing the extents. This is used e.g. when apply_hard_bounds is True and xlim/ylim is set, in which case we limit the initial viewable range to xlim/ylim, but allow navigation up to the abs max between the data range and xlim/ylim.
- get_padding(obj, extents)[source]#
Computes padding along the axes taking into account the plot aspect.
- get_zorder(overlay, key, el)[source]#
Computes the z-order of element in the NdOverlay taking into account possible batching of elements.
- init_artists(ax, plot_args, plot_kwargs)[source]#
Initializes the artist based on the plot method declared on the plot.
- refresh(**kwargs)[source]#
Refreshes the plot by rerendering it and then pushing the updated data if the plot has an associated Comm.
- property state#
The plotting state that gets updated via the update method and used by the renderer to generate output.
- teardown_handles()[source]#
If no custom update_handles method is supplied this method is called to tear down any previous handles before replacing them.
- traverse(fn=None, specs=None, full_breadth=True)[source]#
Traverses any nested DimensionedPlot returning a list of all plots that match the specs. The specs should be supplied as a list of either Plot types or callables, which should return a boolean given the plot class.
- update(key)[source]#
Update the internal state of the Plot to represent the given key tuple (where integers represent frames). Returns this state.
geometry Module#

- class holoviews.plotting.mpl.geometry.RectanglesPlot(*args, **kwargs)[source]#
Bases:
GeomMixin,ColorbarPlotRectangles are polygons in 2D space where the key dimensions represent the bottom-left and top-right corner of the rectangle.
Parameters inherited from:
holoviews.plotting.plot.DimensionedPlot: fontsize, fontscale, show_title, title, normalizeholoviews.plotting.mpl.plot.MPLPlot: projection, backend_opts, fig_alpha, fig_bounds, fig_inches, fig_latex, fig_rcparams, fig_size, initial_hooks, sublabel_format, sublabel_position, sublabel_size, show_frameholoviews.plotting.plot.GenericElementPlot: apply_ranges, apply_extents, bgcolor, default_span, hooks, invert_axes, invert_xaxis, invert_yaxis, logx, logy, padding, show_legend, show_grid, xaxis, yaxis, xlabel, ylabel, xlim, ylim, zlim, xrotation, yrotation, xticks, yticksholoviews.plotting.mpl.element.ElementPlot: apply_ticks, aspect, data_aspect, invert_zaxis, labelled, logz, xformatter, yformatter, zformatter, zaxis, zlabel, zrotation, zticksholoviews.plotting.mpl.element.ColorbarPlot: clabel, clim, clim_percentile, cformatter, colorbar, colorbar_opts, color_levels, cnorm, clipping_colors, cbar_padding, cbar_ticks, cbar_width, cbar_extend, rescale_discrete_levels, symmetric- anim(start=0, stop=None, fps=30)[source]#
Method to return a matplotlib animation. The start and stop frames may be specified as well as the fps.
- compute_ranges(obj, key, ranges)[source]#
Given an object, a specific key, and the normalization options, this method will find the specified normalization options on the appropriate OptionTree, group the elements according to the selected normalization option (i.e. either per frame or over the whole animation) and finally compute the dimension ranges in each group. The new set of ranges is returned.
- get_extents(element, ranges, range_type='combined', **kwargs)[source]#
Use first two key dimensions to set names, and all four to set the data range.
- get_padding(obj, extents)[source]#
Computes padding along the axes taking into account the plot aspect.
- get_zorder(overlay, key, el)[source]#
Computes the z-order of element in the NdOverlay taking into account possible batching of elements.
- init_artists(ax, plot_args, plot_kwargs)[source]#
Initializes the artist based on the plot method declared on the plot.
- refresh(**kwargs)[source]#
Refreshes the plot by rerendering it and then pushing the updated data if the plot has an associated Comm.
- property state#
The plotting state that gets updated via the update method and used by the renderer to generate output.
- teardown_handles()[source]#
If no custom update_handles method is supplied this method is called to tear down any previous handles before replacing them.
- traverse(fn=None, specs=None, full_breadth=True)[source]#
Traverses any nested DimensionedPlot returning a list of all plots that match the specs. The specs should be supplied as a list of either Plot types or callables, which should return a boolean given the plot class.
- update(key)[source]#
Update the internal state of the Plot to represent the given key tuple (where integers represent frames). Returns this state.
- class holoviews.plotting.mpl.geometry.SegmentPlot(*args, **kwargs)[source]#
Bases:
GeomMixin,ColorbarPlotSegments are lines in 2D space where each two key dimensions specify a (x, y) node of the line.
Parameters inherited from:
holoviews.plotting.plot.DimensionedPlot: fontsize, fontscale, show_title, title, normalizeholoviews.plotting.mpl.plot.MPLPlot: projection, backend_opts, fig_alpha, fig_bounds, fig_inches, fig_latex, fig_rcparams, fig_size, initial_hooks, sublabel_format, sublabel_position, sublabel_size, show_frameholoviews.plotting.plot.GenericElementPlot: apply_ranges, apply_extents, bgcolor, default_span, hooks, invert_axes, invert_xaxis, invert_yaxis, logx, logy, padding, show_legend, show_grid, xaxis, yaxis, xlabel, ylabel, xlim, ylim, zlim, xrotation, yrotation, xticks, yticksholoviews.plotting.mpl.element.ElementPlot: apply_ticks, aspect, data_aspect, invert_zaxis, labelled, logz, xformatter, yformatter, zformatter, zaxis, zlabel, zrotation, zticksholoviews.plotting.mpl.element.ColorbarPlot: clabel, clim, clim_percentile, cformatter, colorbar, colorbar_opts, color_levels, cnorm, clipping_colors, cbar_padding, cbar_ticks, cbar_width, cbar_extend, rescale_discrete_levels, symmetric- anim(start=0, stop=None, fps=30)[source]#
Method to return a matplotlib animation. The start and stop frames may be specified as well as the fps.
- compute_ranges(obj, key, ranges)[source]#
Given an object, a specific key, and the normalization options, this method will find the specified normalization options on the appropriate OptionTree, group the elements according to the selected normalization option (i.e. either per frame or over the whole animation) and finally compute the dimension ranges in each group. The new set of ranges is returned.
- get_extents(element, ranges, range_type='combined', **kwargs)[source]#
Use first two key dimensions to set names, and all four to set the data range.
- get_padding(obj, extents)[source]#
Computes padding along the axes taking into account the plot aspect.
- get_zorder(overlay, key, el)[source]#
Computes the z-order of element in the NdOverlay taking into account possible batching of elements.
- init_artists(ax, plot_args, plot_kwargs)[source]#
Initializes the artist based on the plot method declared on the plot.
- refresh(**kwargs)[source]#
Refreshes the plot by rerendering it and then pushing the updated data if the plot has an associated Comm.
- property state#
The plotting state that gets updated via the update method and used by the renderer to generate output.
- teardown_handles()[source]#
If no custom update_handles method is supplied this method is called to tear down any previous handles before replacing them.
- traverse(fn=None, specs=None, full_breadth=True)[source]#
Traverses any nested DimensionedPlot returning a list of all plots that match the specs. The specs should be supplied as a list of either Plot types or callables, which should return a boolean given the plot class.
- update(key)[source]#
Update the internal state of the Plot to represent the given key tuple (where integers represent frames). Returns this state.
graphs Module#

- class holoviews.plotting.mpl.graphs.ChordPlot(*args, **kwargs)[source]#
Bases:
ChordMixin,GraphPlotParameters inherited from:
holoviews.plotting.plot.DimensionedPlot: fontsize, fontscale, show_title, title, normalizeholoviews.plotting.mpl.plot.MPLPlot: projection, backend_opts, fig_alpha, fig_bounds, fig_inches, fig_latex, fig_rcparams, fig_size, initial_hooks, sublabel_format, sublabel_position, sublabel_size, show_frameholoviews.plotting.plot.GenericElementPlot: apply_ranges, apply_extents, bgcolor, default_span, hooks, invert_axes, invert_xaxis, invert_yaxis, logx, logy, padding, show_legend, show_grid, xaxis, yaxis, xlabel, ylabel, xlim, ylim, zlim, xrotation, yrotation, xticks, yticksholoviews.plotting.mpl.element.ElementPlot: apply_ticks, aspect, data_aspect, invert_zaxis, labelled, logz, xformatter, yformatter, zformatter, zaxis, zlabel, zrotation, zticksholoviews.plotting.mpl.element.ColorbarPlot: clabel, clim, clim_percentile, cformatter, colorbar, colorbar_opts, color_levels, cnorm, clipping_colors, cbar_padding, cbar_ticks, cbar_width, cbar_extend, rescale_discrete_levels, symmetricholoviews.plotting.mpl.graphs.GraphPlot: arrowhead_length, directed, color_index, edge_color_indexlabels= param.ClassSelector(allow_None=True, allow_refs=False, class_=(<class ‘str’>, <class ‘holoviews.util.transform.dim’>), label=’Labels’, nested_refs=False, rx=<param.reactive.reactive_ops object at 0x7f6aecced110>)The dimension or dimension value transform used to draw labels from.
label_index= param.ClassSelector(allow_None=True, allow_refs=False, class_=(<class ‘str’>, <class ‘int’>), label=’Label index’, nested_refs=False, rx=<param.reactive.reactive_ops object at 0x7f6aecce89d0>)Index of the dimension from which the node labels will be drawn
- anim(start=0, stop=None, fps=30)[source]#
Method to return a matplotlib animation. The start and stop frames may be specified as well as the fps.
- compute_ranges(obj, key, ranges)[source]#
Given an object, a specific key, and the normalization options, this method will find the specified normalization options on the appropriate OptionTree, group the elements according to the selected normalization option (i.e. either per frame or over the whole animation) and finally compute the dimension ranges in each group. The new set of ranges is returned.
- get_extents(element, ranges, range_type='combined', **kwargs)[source]#
A Chord plot is always drawn on a unit circle.
- get_padding(obj, extents)[source]#
Computes padding along the axes taking into account the plot aspect.
- get_zorder(overlay, key, el)[source]#
Computes the z-order of element in the NdOverlay taking into account possible batching of elements.
- init_artists(ax, plot_args, plot_kwargs)[source]#
Initializes the artist based on the plot method declared on the plot.
- refresh(**kwargs)[source]#
Refreshes the plot by rerendering it and then pushing the updated data if the plot has an associated Comm.
- property state#
The plotting state that gets updated via the update method and used by the renderer to generate output.
- teardown_handles()[source]#
If no custom update_handles method is supplied this method is called to tear down any previous handles before replacing them.
- traverse(fn=None, specs=None, full_breadth=True)[source]#
Traverses any nested DimensionedPlot returning a list of all plots that match the specs. The specs should be supplied as a list of either Plot types or callables, which should return a boolean given the plot class.
- update(key)[source]#
Update the internal state of the Plot to represent the given key tuple (where integers represent frames). Returns this state.
- class holoviews.plotting.mpl.graphs.GraphPlot(*args, **kwargs)[source]#
Bases:
GraphMixin,ColorbarPlotParameters inherited from:
holoviews.plotting.plot.DimensionedPlot: fontsize, fontscale, show_title, title, normalizeholoviews.plotting.mpl.plot.MPLPlot: projection, backend_opts, fig_alpha, fig_bounds, fig_inches, fig_latex, fig_rcparams, fig_size, initial_hooks, sublabel_format, sublabel_position, sublabel_size, show_frameholoviews.plotting.plot.GenericElementPlot: apply_ranges, apply_extents, bgcolor, default_span, hooks, invert_axes, invert_xaxis, invert_yaxis, logx, logy, padding, show_legend, show_grid, xaxis, yaxis, xlabel, ylabel, xlim, ylim, zlim, xrotation, yrotation, xticks, yticksholoviews.plotting.mpl.element.ElementPlot: apply_ticks, aspect, data_aspect, invert_zaxis, labelled, logz, xformatter, yformatter, zformatter, zaxis, zlabel, zrotation, zticksholoviews.plotting.mpl.element.ColorbarPlot: clabel, clim, clim_percentile, cformatter, colorbar, colorbar_opts, color_levels, cnorm, clipping_colors, cbar_padding, cbar_ticks, cbar_width, cbar_extend, rescale_discrete_levels, symmetricarrowhead_length= param.Number(allow_refs=False, default=0.025, inclusive_bounds=(True, True), label=’Arrowhead length’, nested_refs=False, rx=<param.reactive.reactive_ops object at 0x7f6aecd19910>)If directed option is enabled this determines the length of the arrows as fraction of the overall extent of the graph.
directed= param.Boolean(allow_refs=False, default=False, label=’Directed’, nested_refs=False, rx=<param.reactive.reactive_ops object at 0x7f6aecd1b150>)Whether to draw arrows on the graph edges to indicate the directionality of each edge.
color_index= param.ClassSelector(allow_None=True, allow_refs=False, class_=(<class ‘str’>, <class ‘int’>), label=’Color index’, nested_refs=False, rx=<param.reactive.reactive_ops object at 0x7f6aecd19190>)Deprecated in favor of color style mapping, e.g. node_color=dim(‘color’)
edge_color_index= param.ClassSelector(allow_None=True, allow_refs=False, class_=(<class ‘str’>, <class ‘int’>), label=’Edge color index’, nested_refs=False, rx=<param.reactive.reactive_ops object at 0x7f6aecd1b150>)Deprecated in favor of color style mapping, e.g. edge_color=dim(‘color’)
- anim(start=0, stop=None, fps=30)[source]#
Method to return a matplotlib animation. The start and stop frames may be specified as well as the fps.
- compute_ranges(obj, key, ranges)[source]#
Given an object, a specific key, and the normalization options, this method will find the specified normalization options on the appropriate OptionTree, group the elements according to the selected normalization option (i.e. either per frame or over the whole animation) and finally compute the dimension ranges in each group. The new set of ranges is returned.
- get_extents(element, ranges, range_type='combined', **kwargs)[source]#
Gets the extents for the axes from the current Element. The globally computed ranges can optionally override the extents.
The extents are computed by combining the data ranges, extents and dimension ranges. Each of these can be obtained individually by setting the range_type to one of:
‘data’: Just the data ranges
‘extents’: Element.extents
‘soft’: Dimension.soft_range values
‘hard’: Dimension.range values
To obtain the combined range, which includes range padding the default may be used:
‘combined’: All the range types combined and padding applied
This allows Overlay plots to obtain each range and combine them appropriately for all the objects in the overlay.
If lims_as_soft_ranges is set to True, the xlim and ylim will be treated as soft ranges instead of the default case as hard ranges while computing the extents. This is used e.g. when apply_hard_bounds is True and xlim/ylim is set, in which case we limit the initial viewable range to xlim/ylim, but allow navigation up to the abs max between the data range and xlim/ylim.
- get_padding(obj, extents)[source]#
Computes padding along the axes taking into account the plot aspect.
- get_zorder(overlay, key, el)[source]#
Computes the z-order of element in the NdOverlay taking into account possible batching of elements.
- init_artists(ax, plot_args, plot_kwargs)[source]#
Initializes the artist based on the plot method declared on the plot.
- refresh(**kwargs)[source]#
Refreshes the plot by rerendering it and then pushing the updated data if the plot has an associated Comm.
- property state#
The plotting state that gets updated via the update method and used by the renderer to generate output.
- teardown_handles()[source]#
If no custom update_handles method is supplied this method is called to tear down any previous handles before replacing them.
- traverse(fn=None, specs=None, full_breadth=True)[source]#
Traverses any nested DimensionedPlot returning a list of all plots that match the specs. The specs should be supplied as a list of either Plot types or callables, which should return a boolean given the plot class.
- update(key)[source]#
Update the internal state of the Plot to represent the given key tuple (where integers represent frames). Returns this state.
- class holoviews.plotting.mpl.graphs.TriMeshPlot(*args, **kwargs)[source]#
Bases:
GraphPlotParameters inherited from:
holoviews.plotting.plot.DimensionedPlot: fontsize, fontscale, show_title, title, normalizeholoviews.plotting.mpl.plot.MPLPlot: projection, backend_opts, fig_alpha, fig_bounds, fig_inches, fig_latex, fig_rcparams, fig_size, initial_hooks, sublabel_format, sublabel_position, sublabel_size, show_frameholoviews.plotting.plot.GenericElementPlot: apply_ranges, apply_extents, bgcolor, default_span, hooks, invert_axes, invert_xaxis, invert_yaxis, logx, logy, padding, show_legend, show_grid, xaxis, yaxis, xlabel, ylabel, xlim, ylim, zlim, xrotation, yrotation, xticks, yticksholoviews.plotting.mpl.element.ElementPlot: apply_ticks, aspect, data_aspect, invert_zaxis, labelled, logz, xformatter, yformatter, zformatter, zaxis, zlabel, zrotation, zticksholoviews.plotting.mpl.element.ColorbarPlot: clabel, clim, clim_percentile, cformatter, colorbar, colorbar_opts, color_levels, cnorm, clipping_colors, cbar_padding, cbar_ticks, cbar_width, cbar_extend, rescale_discrete_levels, symmetricholoviews.plotting.mpl.graphs.GraphPlot: arrowhead_length, directed, color_index, edge_color_indexfilled= param.Boolean(allow_refs=False, default=False, label=’Filled’, nested_refs=False, rx=<param.reactive.reactive_ops object at 0x7f6aecd33190>)Whether the triangles should be drawn as filled.
- anim(start=0, stop=None, fps=30)[source]#
Method to return a matplotlib animation. The start and stop frames may be specified as well as the fps.
- compute_ranges(obj, key, ranges)[source]#
Given an object, a specific key, and the normalization options, this method will find the specified normalization options on the appropriate OptionTree, group the elements according to the selected normalization option (i.e. either per frame or over the whole animation) and finally compute the dimension ranges in each group. The new set of ranges is returned.
- get_extents(element, ranges, range_type='combined', **kwargs)[source]#
Gets the extents for the axes from the current Element. The globally computed ranges can optionally override the extents.
The extents are computed by combining the data ranges, extents and dimension ranges. Each of these can be obtained individually by setting the range_type to one of:
‘data’: Just the data ranges
‘extents’: Element.extents
‘soft’: Dimension.soft_range values
‘hard’: Dimension.range values
To obtain the combined range, which includes range padding the default may be used:
‘combined’: All the range types combined and padding applied
This allows Overlay plots to obtain each range and combine them appropriately for all the objects in the overlay.
If lims_as_soft_ranges is set to True, the xlim and ylim will be treated as soft ranges instead of the default case as hard ranges while computing the extents. This is used e.g. when apply_hard_bounds is True and xlim/ylim is set, in which case we limit the initial viewable range to xlim/ylim, but allow navigation up to the abs max between the data range and xlim/ylim.
- get_padding(obj, extents)[source]#
Computes padding along the axes taking into account the plot aspect.
- get_zorder(overlay, key, el)[source]#
Computes the z-order of element in the NdOverlay taking into account possible batching of elements.
- init_artists(ax, plot_args, plot_kwargs)[source]#
Initializes the artist based on the plot method declared on the plot.
- refresh(**kwargs)[source]#
Refreshes the plot by rerendering it and then pushing the updated data if the plot has an associated Comm.
- property state#
The plotting state that gets updated via the update method and used by the renderer to generate output.
- teardown_handles()[source]#
If no custom update_handles method is supplied this method is called to tear down any previous handles before replacing them.
- traverse(fn=None, specs=None, full_breadth=True)[source]#
Traverses any nested DimensionedPlot returning a list of all plots that match the specs. The specs should be supplied as a list of either Plot types or callables, which should return a boolean given the plot class.
- update(key)[source]#
Update the internal state of the Plot to represent the given key tuple (where integers represent frames). Returns this state.
heatmap Module#

- class holoviews.plotting.mpl.heatmap.HeatMapPlot(*args, **kwargs)[source]#
Bases:
HeatMapMixin,QuadMeshPlotParameters inherited from:
holoviews.plotting.plot.DimensionedPlot: fontsize, fontscale, show_title, title, normalizeholoviews.plotting.mpl.plot.MPLPlot: projection, backend_opts, fig_alpha, fig_bounds, fig_inches, fig_latex, fig_rcparams, fig_size, initial_hooks, sublabel_format, sublabel_position, sublabel_size, show_frameholoviews.plotting.plot.GenericElementPlot: apply_ranges, apply_extents, bgcolor, default_span, hooks, invert_axes, invert_xaxis, invert_yaxis, logx, logy, show_grid, xaxis, yaxis, xlabel, ylabel, xlim, ylim, zlim, xrotation, yrotationholoviews.plotting.mpl.element.ElementPlot: apply_ticks, aspect, data_aspect, invert_zaxis, labelled, logz, xformatter, yformatter, zformatter, zaxis, zlabel, zrotation, zticksholoviews.plotting.mpl.element.ColorbarPlot: clabel, clim, clim_percentile, cformatter, colorbar, colorbar_opts, color_levels, cnorm, cbar_padding, cbar_ticks, cbar_width, cbar_extend, rescale_discrete_levels, symmetricholoviews.plotting.mpl.raster.QuadMeshPlot: show_legend, nodatapadding= param.ClassSelector(allow_refs=False, class_=(<class ‘int’>, <class ‘float’>, <class ‘tuple’>), default=0, label=’Padding’, nested_refs=False, rx=<param.reactive.reactive_ops object at 0x7f6aecc63750>)Fraction by which to increase auto-ranged extents to make datapoints more visible around borders. To compute padding, the axis whose screen size is largest is chosen, and the range of that axis is increased by the specified fraction along each axis. Other axes are then padded ensuring that the amount of screen space devoted to padding is equal for all axes. If specified as a tuple, the int or float values in the tuple will be used for padding in each axis, in order (x,y or x,y,z). For example, for padding=0.2 on a 800x800-pixel plot, an x-axis with the range [0,10] will be padded by 20% to be [-1,11], while a y-axis with a range [0,1000] will be padded to be [-100,1100], which should make the padding be approximately the same number of pixels. But if the same plot is changed to have a height of only 200, the y-range will then be [-400,1400] so that the y-axis padding will still match that of the x-axis. It is also possible to declare non-equal padding value for the lower and upper bound of an axis by supplying nested tuples, e.g. padding=(0.1, (0, 0.1)) will pad the x-axis lower and upper bound as well as the y-axis upper bound by a fraction of 0.1 while the y-axis lower bound is not padded at all.
xticks= param.Parameter(allow_refs=False, default=20, label=’Xticks’, nested_refs=False, rx=<param.reactive.reactive_ops object at 0x7f6aecc7bd50>)Ticks along x-axis/segments specified as an integer, explicit list of ticks or function. If None, no ticks are shown.
yticks= param.Parameter(allow_refs=False, default=20, label=’Yticks’, nested_refs=False, rx=<param.reactive.reactive_ops object at 0x7f6aecc63890>)Ticks along y-axis/annulars specified as an integer, explicit list of ticks or function. If None, no ticks are shown.
clipping_colors= param.Dict(allow_refs=False, class_=<class ‘dict’>, default={‘NaN’: ‘white’}, label=’Clipping colors’, nested_refs=False, rx=<param.reactive.reactive_ops object at 0x7f6aecc7a5d0>)Dictionary to specify colors for clipped values, allows setting color for NaN values and for values above and below the min and max value. The min, max or NaN color may specify an RGB(A) color as a color hex string of the form #FFFFFF or #FFFFFFFF or a length 3 or length 4 tuple specifying values in the range 0-1 or a named HTML color.
radial= param.Boolean(allow_refs=False, default=False, label=’Radial’, nested_refs=False, rx=<param.reactive.reactive_ops object at 0x7f6aecc62750>)Whether the HeatMap should be radial
show_values= param.Boolean(allow_refs=False, default=False, label=’Show values’, nested_refs=False, rx=<param.reactive.reactive_ops object at 0x7f6aecc7b890>)Whether to annotate each pixel with its value.
xmarks= param.Parameter(allow_None=True, allow_refs=False, label=’Xmarks’, nested_refs=False, rx=<param.reactive.reactive_ops object at 0x7f6aecc605d0>)Add separation lines to the heatmap for better readability. By default, does not show any separation lines. If parameter is of type integer, draws the given amount of separations lines spread across heatmap. If parameter is of type list containing integers, show separation lines at given indices. If parameter is of type tuple, draw separation lines at given categorical values. If parameter is of type function, draw separation lines where function returns True for passed heatmap category.
ymarks= param.Parameter(allow_None=True, allow_refs=False, label=’Ymarks’, nested_refs=False, rx=<param.reactive.reactive_ops object at 0x7f6aecc62750>)Add separation lines to the heatmap for better readability. By default, does not show any separation lines. If parameter is of type integer, draws the given amount of separations lines spread across heatmap. If parameter is of type list containing integers, show separation lines at given indices. If parameter is of type tuple, draw separation lines at given categorical values. If parameter is of type function, draw separation lines where function returns True for passed heatmap category.
- anim(start=0, stop=None, fps=30)[source]#
Method to return a matplotlib animation. The start and stop frames may be specified as well as the fps.
- compute_ranges(obj, key, ranges)[source]#
Given an object, a specific key, and the normalization options, this method will find the specified normalization options on the appropriate OptionTree, group the elements according to the selected normalization option (i.e. either per frame or over the whole animation) and finally compute the dimension ranges in each group. The new set of ranges is returned.
- get_extents(element, ranges, range_type='combined', **kwargs)[source]#
Gets the extents for the axes from the current Element. The globally computed ranges can optionally override the extents.
The extents are computed by combining the data ranges, extents and dimension ranges. Each of these can be obtained individually by setting the range_type to one of:
‘data’: Just the data ranges
‘extents’: Element.extents
‘soft’: Dimension.soft_range values
‘hard’: Dimension.range values
To obtain the combined range, which includes range padding the default may be used:
‘combined’: All the range types combined and padding applied
This allows Overlay plots to obtain each range and combine them appropriately for all the objects in the overlay.
If lims_as_soft_ranges is set to True, the xlim and ylim will be treated as soft ranges instead of the default case as hard ranges while computing the extents. This is used e.g. when apply_hard_bounds is True and xlim/ylim is set, in which case we limit the initial viewable range to xlim/ylim, but allow navigation up to the abs max between the data range and xlim/ylim.
- get_padding(obj, extents)[source]#
Computes padding along the axes taking into account the plot aspect.
- get_zorder(overlay, key, el)[source]#
Computes the z-order of element in the NdOverlay taking into account possible batching of elements.
- init_artists(ax, plot_args, plot_kwargs)[source]#
Initializes the artist based on the plot method declared on the plot.
- refresh(**kwargs)[source]#
Refreshes the plot by rerendering it and then pushing the updated data if the plot has an associated Comm.
- property state#
The plotting state that gets updated via the update method and used by the renderer to generate output.
- teardown_handles()[source]#
If no custom update_handles method is supplied this method is called to tear down any previous handles before replacing them.
- traverse(fn=None, specs=None, full_breadth=True)[source]#
Traverses any nested DimensionedPlot returning a list of all plots that match the specs. The specs should be supplied as a list of either Plot types or callables, which should return a boolean given the plot class.
- update(key)[source]#
Update the internal state of the Plot to represent the given key tuple (where integers represent frames). Returns this state.
- class holoviews.plotting.mpl.heatmap.RadialHeatMapPlot(*args, **kwargs)[source]#
Bases:
ColorbarPlotParameters inherited from:
holoviews.plotting.plot.DimensionedPlot: fontsize, fontscale, show_title, title, normalizeholoviews.plotting.mpl.plot.MPLPlot: backend_opts, fig_alpha, fig_bounds, fig_inches, fig_latex, fig_rcparams, fig_size, initial_hooks, sublabel_format, sublabel_position, sublabel_size, show_frameholoviews.plotting.plot.GenericElementPlot: apply_ranges, apply_extents, bgcolor, default_span, hooks, invert_axes, invert_xaxis, invert_yaxis, logx, logy, padding, show_legend, show_grid, xaxis, yaxis, xlabel, ylabel, xlim, ylim, zlim, xrotation, yrotationholoviews.plotting.mpl.element.ElementPlot: apply_ticks, aspect, data_aspect, invert_zaxis, labelled, logz, xformatter, yformatter, zformatter, zaxis, zlabel, zrotation, zticksholoviews.plotting.mpl.element.ColorbarPlot: clabel, clim, clim_percentile, cformatter, colorbar, colorbar_opts, color_levels, cnorm, clipping_colors, cbar_padding, cbar_ticks, cbar_width, cbar_extend, rescale_discrete_levels, symmetricprojection= param.ObjectSelector(allow_refs=False, default=’polar’, label=’Projection’, names={}, nested_refs=False, objects=[‘polar’], rx=<param.reactive.reactive_ops object at 0x7f6aecaa9bd0>)The projection of the plot axis, default of None is equivalent to 2D plot, ‘3d’ and ‘polar’ are also supported by matplotlib by default. May also supply a custom projection that is either a matplotlib projection type or implements the _as_mpl_axes method.
xticks= param.Parameter(allow_refs=False, default=4, label=’Xticks’, nested_refs=False, rx=<param.reactive.reactive_ops object at 0x7f6aecaab2d0>)Ticks along x-axis/segments specified as an integer, explicit list of ticks or function. If None, no ticks are shown.
yticks= param.Parameter(allow_refs=False, default=4, label=’Yticks’, nested_refs=False, rx=<param.reactive.reactive_ops object at 0x7f6aecaa9650>)Ticks along y-axis/annulars specified as an integer, explicit list of ticks or function. If None, no ticks are shown.
start_angle= param.Number(allow_refs=False, default=1.5707963267948966, inclusive_bounds=(True, True), label=’Start angle’, nested_refs=False, rx=<param.reactive.reactive_ops object at 0x7f6aecaab4d0>)Define starting angle of the first annulars. By default, beings at 12 o clock.
max_radius= param.Number(allow_refs=False, default=0.5, inclusive_bounds=(True, True), label=’Max radius’, nested_refs=False, rx=<param.reactive.reactive_ops object at 0x7f6aecaabb90>)Define the maximum radius which is used for the x and y range extents.
radius_inner= param.Number(allow_refs=False, bounds=(0, 0.5), default=0.1, inclusive_bounds=(True, True), label=’Radius inner’, nested_refs=False, rx=<param.reactive.reactive_ops object at 0x7f6aecaab610>)Define the radius fraction of inner, empty space.
radius_outer= param.Number(allow_refs=False, bounds=(0, 1), default=0.05, inclusive_bounds=(True, True), label=’Radius outer’, nested_refs=False, rx=<param.reactive.reactive_ops object at 0x7f6aecaabb10>)Define the radius fraction of outer space including the labels.
radial= param.Boolean(allow_refs=False, default=True, label=’Radial’, nested_refs=False, rx=<param.reactive.reactive_ops object at 0x7f6aecaaaf90>)Whether the HeatMap should be radial
show_values= param.Boolean(allow_refs=False, default=False, label=’Show values’, nested_refs=False, rx=<param.reactive.reactive_ops object at 0x7f6aecaa9bd0>)Whether to annotate each pixel with its value.
xmarks= param.Parameter(allow_None=True, allow_refs=False, label=’Xmarks’, nested_refs=False, rx=<param.reactive.reactive_ops object at 0x7f6aecaab3d0>)Add separation lines between segments for better readability. By default, does not show any separation lines. If parameter is of type integer, draws the given amount of separations lines spread across radial heatmap. If parameter is of type list containing integers, show separation lines at given indices. If parameter is of type tuple, draw separation lines at given segment values. If parameter is of type function, draw separation lines where function returns True for passed segment value.
ymarks= param.Parameter(allow_None=True, allow_refs=False, label=’Ymarks’, nested_refs=False, rx=<param.reactive.reactive_ops object at 0x7f6aecaab850>)Add separation lines between annulars for better readability. By default, does not show any separation lines. If parameter is of type integer, draws the given amount of separations lines spread across radial heatmap. If parameter is of type list containing integers, show separation lines at given indices. If parameter is of type tuple, draw separation lines at given annular values. If parameter is of type function, draw separation lines where function returns True for passed annular value.
- anim(start=0, stop=None, fps=30)[source]#
Method to return a matplotlib animation. The start and stop frames may be specified as well as the fps.
- compute_ranges(obj, key, ranges)[source]#
Given an object, a specific key, and the normalization options, this method will find the specified normalization options on the appropriate OptionTree, group the elements according to the selected normalization option (i.e. either per frame or over the whole animation) and finally compute the dimension ranges in each group. The new set of ranges is returned.
- get_extents(view, ranges, range_type='combined', **kwargs)[source]#
Gets the extents for the axes from the current Element. The globally computed ranges can optionally override the extents.
The extents are computed by combining the data ranges, extents and dimension ranges. Each of these can be obtained individually by setting the range_type to one of:
‘data’: Just the data ranges
‘extents’: Element.extents
‘soft’: Dimension.soft_range values
‘hard’: Dimension.range values
To obtain the combined range, which includes range padding the default may be used:
‘combined’: All the range types combined and padding applied
This allows Overlay plots to obtain each range and combine them appropriately for all the objects in the overlay.
If lims_as_soft_ranges is set to True, the xlim and ylim will be treated as soft ranges instead of the default case as hard ranges while computing the extents. This is used e.g. when apply_hard_bounds is True and xlim/ylim is set, in which case we limit the initial viewable range to xlim/ylim, but allow navigation up to the abs max between the data range and xlim/ylim.
- get_padding(obj, extents)[source]#
Computes padding along the axes taking into account the plot aspect.
- get_zorder(overlay, key, el)[source]#
Computes the z-order of element in the NdOverlay taking into account possible batching of elements.
- init_artists(ax, plot_args, plot_kwargs)[source]#
Initializes the artist based on the plot method declared on the plot.
- refresh(**kwargs)[source]#
Refreshes the plot by rerendering it and then pushing the updated data if the plot has an associated Comm.
- property state#
The plotting state that gets updated via the update method and used by the renderer to generate output.
- teardown_handles()[source]#
If no custom update_handles method is supplied this method is called to tear down any previous handles before replacing them.
- traverse(fn=None, specs=None, full_breadth=True)[source]#
Traverses any nested DimensionedPlot returning a list of all plots that match the specs. The specs should be supplied as a list of either Plot types or callables, which should return a boolean given the plot class.
- update(key)[source]#
Update the internal state of the Plot to represent the given key tuple (where integers represent frames). Returns this state.
hex_tiles Module#

- class holoviews.plotting.mpl.hex_tiles.HexTilesPlot(*args, **kwargs)[source]#
Bases:
ColorbarPlotParameters inherited from:
holoviews.plotting.plot.DimensionedPlot: fontsize, fontscale, show_title, title, normalizeholoviews.plotting.mpl.plot.MPLPlot: projection, backend_opts, fig_alpha, fig_bounds, fig_inches, fig_latex, fig_rcparams, fig_size, initial_hooks, sublabel_format, sublabel_position, sublabel_size, show_frameholoviews.plotting.plot.GenericElementPlot: apply_ranges, apply_extents, bgcolor, default_span, hooks, invert_axes, invert_xaxis, invert_yaxis, logx, logy, padding, show_legend, show_grid, xaxis, yaxis, xlabel, ylabel, xlim, ylim, zlim, xrotation, yrotation, xticks, yticksholoviews.plotting.mpl.element.ElementPlot: apply_ticks, aspect, data_aspect, invert_zaxis, labelled, logz, xformatter, yformatter, zformatter, zaxis, zlabel, zrotation, zticksholoviews.plotting.mpl.element.ColorbarPlot: clabel, clim, clim_percentile, cformatter, colorbar, colorbar_opts, color_levels, cnorm, clipping_colors, cbar_padding, cbar_ticks, cbar_width, cbar_extend, rescale_discrete_levels, symmetricaggregator= param.Callable(allow_refs=False, default=<function size at 0x7f6b44a163b0>, label=’Aggregator’, nested_refs=False, rx=<param.reactive.reactive_ops object at 0x7f6aeca06110>)Aggregation function used to compute bin values. Any NumPy reduction is allowed, defaulting to np.size to count the number of values in each bin.
gridsize= param.ClassSelector(allow_refs=False, class_=(<class ‘int’>, <class ‘tuple’>), default=50, label=’Gridsize’, nested_refs=False, rx=<param.reactive.reactive_ops object at 0x7f6aeca04210>)Number of hexagonal bins along x- and y-axes. Defaults to uniform sampling along both axes when setting and integer but independent bin sampling can be specified a tuple of integers corresponding to the number of bins along each axis.
max_scale= param.Number(allow_refs=False, bounds=(0, None), default=0.9, inclusive_bounds=(True, True), label=’Max scale’, nested_refs=False, rx=<param.reactive.reactive_ops object at 0x7f6aeca03ad0>)When size_index is enabled this defines the maximum size of each bin relative to uniform tile size, i.e. for a value of 1, the largest bin will match the size of bins when scaling is disabled. Setting value larger than 1 will result in overlapping bins.
min_count= param.Number(allow_None=True, allow_refs=False, inclusive_bounds=(True, True), label=’Min count’, nested_refs=False, rx=<param.reactive.reactive_ops object at 0x7f6aeca09e90>)The display threshold before a bin is shown, by default bins with a count of less than 1 are hidden.
- aggregator(axis=None)[source]#
Return the number of elements along a given axis.
Parameters#
- aarray_like
Input data.
- axisint, optional
Axis along which the elements are counted. By default, give the total number of elements.
Returns#
- element_countint
Number of elements along the specified axis.
See Also#
shape : dimensions of array ndarray.shape : dimensions of array ndarray.size : number of elements in array
Examples#
>>> a = np.array([[1,2,3],[4,5,6]])
>>> np.size(a)
6
>>> np.size(a,1)
3
>>> np.size(a,0)
2
- anim(start=0, stop=None, fps=30)[source]#
Method to return a matplotlib animation. The start and stop frames may be specified as well as the fps.
- compute_ranges(obj, key, ranges)[source]#
Given an object, a specific key, and the normalization options, this method will find the specified normalization options on the appropriate OptionTree, group the elements according to the selected normalization option (i.e. either per frame or over the whole animation) and finally compute the dimension ranges in each group. The new set of ranges is returned.
- get_extents(element, ranges, range_type='combined', dimension=None, xdim=None, ydim=None, zdim=None, lims_as_soft_ranges=False, **kwargs)[source]#
Gets the extents for the axes from the current Element. The globally computed ranges can optionally override the extents.
The extents are computed by combining the data ranges, extents and dimension ranges. Each of these can be obtained individually by setting the range_type to one of:
‘data’: Just the data ranges
‘extents’: Element.extents
‘soft’: Dimension.soft_range values
‘hard’: Dimension.range values
To obtain the combined range, which includes range padding the default may be used:
‘combined’: All the range types combined and padding applied
This allows Overlay plots to obtain each range and combine them appropriately for all the objects in the overlay.
If lims_as_soft_ranges is set to True, the xlim and ylim will be treated as soft ranges instead of the default case as hard ranges while computing the extents. This is used e.g. when apply_hard_bounds is True and xlim/ylim is set, in which case we limit the initial viewable range to xlim/ylim, but allow navigation up to the abs max between the data range and xlim/ylim.
- get_padding(obj, extents)[source]#
Computes padding along the axes taking into account the plot aspect.
- get_zorder(overlay, key, el)[source]#
Computes the z-order of element in the NdOverlay taking into account possible batching of elements.
- init_artists(ax, plot_args, plot_kwargs)[source]#
Initializes the artist based on the plot method declared on the plot.
- refresh(**kwargs)[source]#
Refreshes the plot by rerendering it and then pushing the updated data if the plot has an associated Comm.
- property state#
The plotting state that gets updated via the update method and used by the renderer to generate output.
- teardown_handles()[source]#
If no custom update_handles method is supplied this method is called to tear down any previous handles before replacing them.
- traverse(fn=None, specs=None, full_breadth=True)[source]#
Traverses any nested DimensionedPlot returning a list of all plots that match the specs. The specs should be supplied as a list of either Plot types or callables, which should return a boolean given the plot class.
- update(key)[source]#
Update the internal state of the Plot to represent the given key tuple (where integers represent frames). Returns this state.
path Module#

- class holoviews.plotting.mpl.path.ContourPlot(*args, **kwargs)[source]#
Bases:
PathPlotParameters inherited from:
holoviews.plotting.plot.DimensionedPlot: fontsize, fontscale, show_title, title, normalizeholoviews.plotting.mpl.plot.MPLPlot: projection, backend_opts, fig_alpha, fig_bounds, fig_inches, fig_latex, fig_rcparams, fig_size, initial_hooks, sublabel_format, sublabel_position, sublabel_size, show_frameholoviews.plotting.plot.GenericElementPlot: apply_ranges, apply_extents, bgcolor, default_span, hooks, invert_axes, invert_xaxis, invert_yaxis, logx, logy, padding, show_grid, xaxis, yaxis, xlabel, ylabel, xlim, ylim, zlim, xrotation, yrotation, xticks, yticksholoviews.plotting.mpl.element.ElementPlot: apply_ticks, data_aspect, invert_zaxis, labelled, logz, xformatter, yformatter, zformatter, zaxis, zlabel, zrotation, zticksholoviews.plotting.mpl.element.ColorbarPlot: clabel, clim, clim_percentile, cformatter, colorbar, colorbar_opts, color_levels, cnorm, clipping_colors, cbar_padding, cbar_ticks, cbar_width, cbar_extend, rescale_discrete_levels, symmetricholoviews.plotting.mpl.path.PathPlot: show_legend, aspectcolor_index= param.ClassSelector(allow_None=True, allow_refs=False, class_=(<class ‘str’>, <class ‘int’>), default=0, label=’Color index’, nested_refs=False, rx=<param.reactive.reactive_ops object at 0x7f6aeca70190>)Index of the dimension from which the color will the drawn
- anim(start=0, stop=None, fps=30)[source]#
Method to return a matplotlib animation. The start and stop frames may be specified as well as the fps.
- compute_ranges(obj, key, ranges)[source]#
Given an object, a specific key, and the normalization options, this method will find the specified normalization options on the appropriate OptionTree, group the elements according to the selected normalization option (i.e. either per frame or over the whole animation) and finally compute the dimension ranges in each group. The new set of ranges is returned.
- get_extents(element, ranges, range_type='combined', dimension=None, xdim=None, ydim=None, zdim=None, lims_as_soft_ranges=False, **kwargs)[source]#
Gets the extents for the axes from the current Element. The globally computed ranges can optionally override the extents.
The extents are computed by combining the data ranges, extents and dimension ranges. Each of these can be obtained individually by setting the range_type to one of:
‘data’: Just the data ranges
‘extents’: Element.extents
‘soft’: Dimension.soft_range values
‘hard’: Dimension.range values
To obtain the combined range, which includes range padding the default may be used:
‘combined’: All the range types combined and padding applied
This allows Overlay plots to obtain each range and combine them appropriately for all the objects in the overlay.
If lims_as_soft_ranges is set to True, the xlim and ylim will be treated as soft ranges instead of the default case as hard ranges while computing the extents. This is used e.g. when apply_hard_bounds is True and xlim/ylim is set, in which case we limit the initial viewable range to xlim/ylim, but allow navigation up to the abs max between the data range and xlim/ylim.
- get_padding(obj, extents)[source]#
Computes padding along the axes taking into account the plot aspect.
- get_zorder(overlay, key, el)[source]#
Computes the z-order of element in the NdOverlay taking into account possible batching of elements.
- init_artists(ax, plot_args, plot_kwargs)[source]#
Initializes the artist based on the plot method declared on the plot.
- refresh(**kwargs)[source]#
Refreshes the plot by rerendering it and then pushing the updated data if the plot has an associated Comm.
- property state#
The plotting state that gets updated via the update method and used by the renderer to generate output.
- teardown_handles()[source]#
If no custom update_handles method is supplied this method is called to tear down any previous handles before replacing them.
- traverse(fn=None, specs=None, full_breadth=True)[source]#
Traverses any nested DimensionedPlot returning a list of all plots that match the specs. The specs should be supplied as a list of either Plot types or callables, which should return a boolean given the plot class.
- update(key)[source]#
Update the internal state of the Plot to represent the given key tuple (where integers represent frames). Returns this state.
- class holoviews.plotting.mpl.path.PathPlot(*args, **kwargs)[source]#
Bases:
ColorbarPlotParameters inherited from:
holoviews.plotting.plot.DimensionedPlot: fontsize, fontscale, show_title, title, normalizeholoviews.plotting.mpl.plot.MPLPlot: projection, backend_opts, fig_alpha, fig_bounds, fig_inches, fig_latex, fig_rcparams, fig_size, initial_hooks, sublabel_format, sublabel_position, sublabel_size, show_frameholoviews.plotting.plot.GenericElementPlot: apply_ranges, apply_extents, bgcolor, default_span, hooks, invert_axes, invert_xaxis, invert_yaxis, logx, logy, padding, show_grid, xaxis, yaxis, xlabel, ylabel, xlim, ylim, zlim, xrotation, yrotation, xticks, yticksholoviews.plotting.mpl.element.ElementPlot: apply_ticks, data_aspect, invert_zaxis, labelled, logz, xformatter, yformatter, zformatter, zaxis, zlabel, zrotation, zticksholoviews.plotting.mpl.element.ColorbarPlot: clabel, clim, clim_percentile, cformatter, colorbar, colorbar_opts, color_levels, cnorm, clipping_colors, cbar_padding, cbar_ticks, cbar_width, cbar_extend, rescale_discrete_levels, symmetricshow_legend= param.Boolean(allow_refs=False, default=False, label=’Show legend’, nested_refs=False, rx=<param.reactive.reactive_ops object at 0x7f6aec8b76d0>)Whether to show legend for the plot.
aspect= param.Parameter(allow_refs=False, default=’square’, label=’Aspect’, nested_refs=False, rx=<param.reactive.reactive_ops object at 0x7f6aec8ecdd0>)PathPlots axes usually define single space so aspect of Paths follows aspect in data coordinates by default.
color_index= param.ClassSelector(allow_None=True, allow_refs=False, class_=(<class ‘str’>, <class ‘int’>), label=’Color index’, nested_refs=False, rx=<param.reactive.reactive_ops object at 0x7f6aec8ecf50>)Index of the dimension from which the color will the drawn
- anim(start=0, stop=None, fps=30)[source]#
Method to return a matplotlib animation. The start and stop frames may be specified as well as the fps.
- compute_ranges(obj, key, ranges)[source]#
Given an object, a specific key, and the normalization options, this method will find the specified normalization options on the appropriate OptionTree, group the elements according to the selected normalization option (i.e. either per frame or over the whole animation) and finally compute the dimension ranges in each group. The new set of ranges is returned.
- get_extents(element, ranges, range_type='combined', dimension=None, xdim=None, ydim=None, zdim=None, lims_as_soft_ranges=False, **kwargs)[source]#
Gets the extents for the axes from the current Element. The globally computed ranges can optionally override the extents.
The extents are computed by combining the data ranges, extents and dimension ranges. Each of these can be obtained individually by setting the range_type to one of:
‘data’: Just the data ranges
‘extents’: Element.extents
‘soft’: Dimension.soft_range values
‘hard’: Dimension.range values
To obtain the combined range, which includes range padding the default may be used:
‘combined’: All the range types combined and padding applied
This allows Overlay plots to obtain each range and combine them appropriately for all the objects in the overlay.
If lims_as_soft_ranges is set to True, the xlim and ylim will be treated as soft ranges instead of the default case as hard ranges while computing the extents. This is used e.g. when apply_hard_bounds is True and xlim/ylim is set, in which case we limit the initial viewable range to xlim/ylim, but allow navigation up to the abs max between the data range and xlim/ylim.
- get_padding(obj, extents)[source]#
Computes padding along the axes taking into account the plot aspect.
- get_zorder(overlay, key, el)[source]#
Computes the z-order of element in the NdOverlay taking into account possible batching of elements.
- init_artists(ax, plot_args, plot_kwargs)[source]#
Initializes the artist based on the plot method declared on the plot.
- refresh(**kwargs)[source]#
Refreshes the plot by rerendering it and then pushing the updated data if the plot has an associated Comm.
- property state#
The plotting state that gets updated via the update method and used by the renderer to generate output.
- teardown_handles()[source]#
If no custom update_handles method is supplied this method is called to tear down any previous handles before replacing them.
- traverse(fn=None, specs=None, full_breadth=True)[source]#
Traverses any nested DimensionedPlot returning a list of all plots that match the specs. The specs should be supplied as a list of either Plot types or callables, which should return a boolean given the plot class.
- update(key)[source]#
Update the internal state of the Plot to represent the given key tuple (where integers represent frames). Returns this state.
- class holoviews.plotting.mpl.path.PolygonPlot(*args, **kwargs)[source]#
Bases:
ContourPlotPolygonPlot draws the polygon paths in the supplied Polygons object. If the Polygon has an associated value the color of Polygons will be drawn from the supplied cmap, otherwise the supplied facecolor will apply. Facecolor also determines the color for non-finite values.
Parameters inherited from:
holoviews.plotting.plot.DimensionedPlot: fontsize, fontscale, show_title, title, normalizeholoviews.plotting.mpl.plot.MPLPlot: projection, backend_opts, fig_alpha, fig_bounds, fig_inches, fig_latex, fig_rcparams, fig_size, initial_hooks, sublabel_format, sublabel_position, sublabel_size, show_frameholoviews.plotting.plot.GenericElementPlot: apply_ranges, apply_extents, bgcolor, default_span, hooks, invert_axes, invert_xaxis, invert_yaxis, logx, logy, padding, show_grid, xaxis, yaxis, xlabel, ylabel, xlim, ylim, zlim, xrotation, yrotation, xticks, yticksholoviews.plotting.mpl.element.ElementPlot: apply_ticks, data_aspect, invert_zaxis, labelled, logz, xformatter, yformatter, zformatter, zaxis, zlabel, zrotation, zticksholoviews.plotting.mpl.element.ColorbarPlot: clabel, clim, clim_percentile, cformatter, colorbar, colorbar_opts, color_levels, cnorm, clipping_colors, cbar_padding, cbar_ticks, cbar_width, cbar_extend, rescale_discrete_levels, symmetricholoviews.plotting.mpl.path.PathPlot: aspectholoviews.plotting.mpl.path.ContourPlot: color_indexshow_legend= param.Boolean(allow_refs=False, default=False, label=’Show legend’, nested_refs=False, rx=<param.reactive.reactive_ops object at 0x7f6aec8ee750>)Whether to show legend for the plot.
- anim(start=0, stop=None, fps=30)[source]#
Method to return a matplotlib animation. The start and stop frames may be specified as well as the fps.
- compute_ranges(obj, key, ranges)[source]#
Given an object, a specific key, and the normalization options, this method will find the specified normalization options on the appropriate OptionTree, group the elements according to the selected normalization option (i.e. either per frame or over the whole animation) and finally compute the dimension ranges in each group. The new set of ranges is returned.
- get_extents(element, ranges, range_type='combined', dimension=None, xdim=None, ydim=None, zdim=None, lims_as_soft_ranges=False, **kwargs)[source]#
Gets the extents for the axes from the current Element. The globally computed ranges can optionally override the extents.
The extents are computed by combining the data ranges, extents and dimension ranges. Each of these can be obtained individually by setting the range_type to one of:
‘data’: Just the data ranges
‘extents’: Element.extents
‘soft’: Dimension.soft_range values
‘hard’: Dimension.range values
To obtain the combined range, which includes range padding the default may be used:
‘combined’: All the range types combined and padding applied
This allows Overlay plots to obtain each range and combine them appropriately for all the objects in the overlay.
If lims_as_soft_ranges is set to True, the xlim and ylim will be treated as soft ranges instead of the default case as hard ranges while computing the extents. This is used e.g. when apply_hard_bounds is True and xlim/ylim is set, in which case we limit the initial viewable range to xlim/ylim, but allow navigation up to the abs max between the data range and xlim/ylim.
- get_padding(obj, extents)[source]#
Computes padding along the axes taking into account the plot aspect.
- get_zorder(overlay, key, el)[source]#
Computes the z-order of element in the NdOverlay taking into account possible batching of elements.
- init_artists(ax, plot_args, plot_kwargs)[source]#
Initializes the artist based on the plot method declared on the plot.
- refresh(**kwargs)[source]#
Refreshes the plot by rerendering it and then pushing the updated data if the plot has an associated Comm.
- property state#
The plotting state that gets updated via the update method and used by the renderer to generate output.
- teardown_handles()[source]#
If no custom update_handles method is supplied this method is called to tear down any previous handles before replacing them.
- traverse(fn=None, specs=None, full_breadth=True)[source]#
Traverses any nested DimensionedPlot returning a list of all plots that match the specs. The specs should be supplied as a list of either Plot types or callables, which should return a boolean given the plot class.
- update(key)[source]#
Update the internal state of the Plot to represent the given key tuple (where integers represent frames). Returns this state.
plot Module#

- class holoviews.plotting.mpl.plot.AdjoinedPlot(keys=None, dimensions=None, layout_dimensions=None, uniform=True, subplot=False, adjoined=None, layout_num=0, style=None, subplots=None, dynamic=False, **params)[source]#
Bases:
DimensionedPlotParameters inherited from:
holoviews.plotting.plot.DimensionedPlot: fontsize, fontscale, title, normalize, projectionshow_title= param.Boolean(allow_refs=False, default=False, label=’Show title’, nested_refs=False, rx=<param.reactive.reactive_ops object at 0x7f6aec6a6250>)Titles should be disabled on all SidePlots to avoid clutter.
aspect= param.Parameter(allow_refs=False, default=’auto’, label=’Aspect’, nested_refs=False, rx=<param.reactive.reactive_ops object at 0x7f6aec6b7750>)Aspect ratios on SideHistogramPlot should be determined by the AdjointLayoutPlot.
bgcolor= param.Parameter(allow_refs=False, default=(1, 1, 1, 0), label=’Bgcolor’, nested_refs=False, rx=<param.reactive.reactive_ops object at 0x7f6aec6a6690>)Make plot background invisible.
border_size= param.Number(allow_refs=False, default=0.25, inclusive_bounds=(True, True), label=’Border size’, nested_refs=False, rx=<param.reactive.reactive_ops object at 0x7f6aec6b77d0>)The size of the border expressed as a fraction of the main plot.
subplot_size= param.Number(allow_refs=False, default=0.25, inclusive_bounds=(True, True), label=’Subplot size’, nested_refs=False, rx=<param.reactive.reactive_ops object at 0x7f6aec6b7a90>)The size subplots as expressed as a fraction of the main plot.
show_xlabel= param.Boolean(allow_refs=False, default=False, label=’Show xlabel’, nested_refs=False, rx=<param.reactive.reactive_ops object at 0x7f6aec6b7590>)Whether to show the x-label of the plot. Disabled by default because plots are often too cramped to fit the title correctly.
- compute_ranges(obj, key, ranges)[source]#
Given an object, a specific key, and the normalization options, this method will find the specified normalization options on the appropriate OptionTree, group the elements according to the selected normalization option (i.e. either per frame or over the whole animation) and finally compute the dimension ranges in each group. The new set of ranges is returned.
- refresh(**kwargs)[source]#
Refreshes the plot by rerendering it and then pushing the updated data if the plot has an associated Comm.
- property state#
The plotting state that gets updated via the update method and used by the renderer to generate output.
- class holoviews.plotting.mpl.plot.AdjointLayoutPlot(layout, layout_type, subaxes, subplots, **params)[source]#
Bases:
MPLPlot,GenericAdjointLayoutPlotInitially, a AdjointLayoutPlot computes an appropriate layout based for the number of Views in the AdjointLayout object it has been given, but when embedded in a NdLayout, it can recompute the layout to match the number of rows and columns as part of a larger grid.
Parameters inherited from:
holoviews.plotting.plot.DimensionedPlot: fontsize, fontscale, show_title, title, normalizeholoviews.plotting.mpl.plot.MPLPlot: projection, backend_opts, fig_alpha, fig_bounds, fig_inches, fig_latex, fig_rcparams, fig_size, initial_hooks, sublabel_format, sublabel_position, sublabel_size, show_frame- adjust_positions(redraw=True)[source]#
Make adjustments to the positions of subplots (if available) relative to the main plot axes as required.
This method is called by LayoutPlot after an initial pass used to position all the Layouts together. This method allows LayoutPlots to make final adjustments to the axis positions.
- anim(start=0, stop=None, fps=30)[source]#
Method to return a matplotlib animation. The start and stop frames may be specified as well as the fps.
- compute_ranges(obj, key, ranges)[source]#
Given an object, a specific key, and the normalization options, this method will find the specified normalization options on the appropriate OptionTree, group the elements according to the selected normalization option (i.e. either per frame or over the whole animation) and finally compute the dimension ranges in each group. The new set of ranges is returned.
- refresh(**kwargs)[source]#
Refreshes the plot by rerendering it and then pushing the updated data if the plot has an associated Comm.
- property state#
The plotting state that gets updated via the update method and used by the renderer to generate output.
- class holoviews.plotting.mpl.plot.CompositePlot(layout, keys=None, dimensions=None, **params)[source]#
Bases:
GenericCompositePlot,MPLPlotCompositePlot provides a baseclass for plots coordinate multiple subplots to form a Layout.
Parameters inherited from:
holoviews.plotting.plot.DimensionedPlot: fontsize, fontscale, show_title, title, normalizeholoviews.plotting.mpl.plot.MPLPlot: projection, backend_opts, fig_alpha, fig_bounds, fig_inches, fig_latex, fig_rcparams, fig_size, initial_hooks, sublabel_format, sublabel_position, sublabel_size, show_frameshared_axes= param.Boolean(allow_refs=False, default=True, label=’Shared axes’, nested_refs=False, rx=<param.reactive.reactive_ops object at 0x7f6aec870ad0>)Whether axes ranges should be shared across the layout, if disabled switches axiswise normalization option on globally.
- anim(start=0, stop=None, fps=30)[source]#
Method to return a matplotlib animation. The start and stop frames may be specified as well as the fps.
- compute_ranges(obj, key, ranges)[source]#
Given an object, a specific key, and the normalization options, this method will find the specified normalization options on the appropriate OptionTree, group the elements according to the selected normalization option (i.e. either per frame or over the whole animation) and finally compute the dimension ranges in each group. The new set of ranges is returned.
- refresh(**kwargs)[source]#
Refreshes the plot by rerendering it and then pushing the updated data if the plot has an associated Comm.
- property state#
The plotting state that gets updated via the update method and used by the renderer to generate output.
- class holoviews.plotting.mpl.plot.GridPlot(layout, axis=None, create_axes=True, ranges=None, layout_num=1, keys=None, **params)[source]#
Bases:
CompositePlotPlot a group of elements in a grid layout based on a GridSpace element object.
Parameters inherited from:
holoviews.plotting.plot.DimensionedPlot: fontsize, fontscale, show_title, title, normalizeholoviews.plotting.mpl.plot.MPLPlot: projection, backend_opts, fig_alpha, fig_bounds, fig_inches, fig_latex, fig_rcparams, fig_size, initial_hooks, sublabel_format, sublabel_position, sublabel_size, show_frameholoviews.plotting.mpl.plot.CompositePlot: shared_axesaspect= param.Parameter(allow_refs=False, default=’equal’, label=’Aspect’, nested_refs=False, rx=<param.reactive.reactive_ops object at 0x7f6aec84d350>)Aspect ratios on GridPlot should be automatically determined.
padding= param.Number(allow_refs=False, default=0.1, inclusive_bounds=(True, True), label=’Padding’, nested_refs=False, rx=<param.reactive.reactive_ops object at 0x7f6aec85f250>)The amount of padding as a fraction of the total Grid size
shared_xaxis= param.Boolean(allow_refs=False, default=False, label=’Shared xaxis’, nested_refs=False, rx=<param.reactive.reactive_ops object at 0x7f6aec84c190>)If enabled the x-axes of the GridSpace will be drawn from the objects inside the Grid rather than the GridSpace dimensions.
shared_yaxis= param.Boolean(allow_refs=False, default=False, label=’Shared yaxis’, nested_refs=False, rx=<param.reactive.reactive_ops object at 0x7f6aec85e750>)If enabled the x-axes of the GridSpace will be drawn from the objects inside the Grid rather than the GridSpace dimensions.
show_legend= param.Boolean(allow_refs=False, default=False, label=’Show legend’, nested_refs=False, rx=<param.reactive.reactive_ops object at 0x7f6aec84c190>)Legends add to much clutter in a grid and are disabled by default.
xaxis= param.ObjectSelector(allow_refs=False, default=’bottom’, label=’Xaxis’, names={}, nested_refs=False, objects=[‘bottom’, ‘top’, None], rx=<param.reactive.reactive_ops object at 0x7f6aec85f890>)Whether and where to display the xaxis, supported options are ‘bottom’, ‘top’ and None.
yaxis= param.ObjectSelector(allow_refs=False, default=’left’, label=’Yaxis’, names={}, nested_refs=False, objects=[‘left’, ‘right’, None], rx=<param.reactive.reactive_ops object at 0x7f6aec85f4d0>)Whether and where to display the yaxis, supported options are ‘left’, ‘right’ and None.
xrotation= param.Integer(allow_refs=False, bounds=(0, 360), default=0, inclusive_bounds=(True, True), label=’Xrotation’, nested_refs=False, rx=<param.reactive.reactive_ops object at 0x7f6aecb4fdd0>)Rotation angle of the xticks.
yrotation= param.Integer(allow_refs=False, bounds=(0, 360), default=0, inclusive_bounds=(True, True), label=’Yrotation’, nested_refs=False, rx=<param.reactive.reactive_ops object at 0x7f6aec85c3d0>)Rotation angle of the yticks.
- anim(start=0, stop=None, fps=30)[source]#
Method to return a matplotlib animation. The start and stop frames may be specified as well as the fps.
- compute_ranges(obj, key, ranges)[source]#
Given an object, a specific key, and the normalization options, this method will find the specified normalization options on the appropriate OptionTree, group the elements according to the selected normalization option (i.e. either per frame or over the whole animation) and finally compute the dimension ranges in each group. The new set of ranges is returned.
- refresh(**kwargs)[source]#
Refreshes the plot by rerendering it and then pushing the updated data if the plot has an associated Comm.
- property state#
The plotting state that gets updated via the update method and used by the renderer to generate output.
- class holoviews.plotting.mpl.plot.LayoutPlot(layout, keys=None, **params)[source]#
Bases:
GenericLayoutPlot,CompositePlotA LayoutPlot accepts either a Layout or a NdLayout and displays the elements in a cartesian grid in scanline order.
Parameters inherited from:
holoviews.plotting.plot.DimensionedPlot: fontscale, show_title, title, normalizeholoviews.plotting.mpl.plot.MPLPlot: projection, backend_opts, fig_alpha, fig_inches, fig_latex, fig_rcparams, fig_size, initial_hooks, sublabel_format, sublabel_position, sublabel_size, show_frameholoviews.plotting.mpl.plot.CompositePlot: shared_axesholoviews.plotting.plot.GenericLayoutPlot: transposefontsize= param.Parameter(allow_None=True, allow_refs=False, default={‘title’: 16}, label=’Fontsize’, nested_refs=False, rx=<param.reactive.reactive_ops object at 0x7f6aec85fe90>)Specifies various font sizes of the displayed text. Finer control is available by supplying a dictionary where any unmentioned keys revert to the default sizes, e.g: {‘ticks’:20, ‘title’:15, ‘ylabel’:5, ‘xlabel’:5, ‘zlabel’:5, ‘legend’:8, ‘legend_title’:13} You can set the font size of ‘zlabel’, ‘ylabel’ and ‘xlabel’ together using the ‘labels’ key.
fig_bounds= param.NumericTuple(allow_refs=False, default=(0.05, 0.05, 0.95, 0.95), label=’Fig bounds’, length=4, nested_refs=False, rx=<param.reactive.reactive_ops object at 0x7f6aecd924d0>)The bounds of the figure as a 4-tuple of the form (left, bottom, right, top), defining the size of the border around the subplots.
absolute_scaling= param.ObjectSelector(allow_refs=False, default=False, label=’Absolute scaling’, names={}, nested_refs=False, objects=[False], rx=<param.reactive.reactive_ops object at 0x7f6aec7fb2d0>)If aspect_weight is enabled absolute_scaling determines whether axes are scaled relative to the widest plot or whether the aspect scales the axes in absolute terms.
aspect_weight= param.Number(allow_refs=False, default=0, inclusive_bounds=(True, True), label=’Aspect weight’, nested_refs=False, rx=<param.reactive.reactive_ops object at 0x7f6aec6e4590>)Weighting of the individual aspects when computing the Layout grid aspects and overall figure size.
tight= param.Boolean(allow_refs=False, default=False, label=’Tight’, nested_refs=False, rx=<param.reactive.reactive_ops object at 0x7f6aec80d690>)Tightly fit the axes in the layout within the fig_bounds and tight_padding.
tight_padding= param.Parameter(allow_refs=False, default=3, label=’Tight padding’, nested_refs=False, rx=<param.reactive.reactive_ops object at 0x7f6aec80d8d0>)Integer or tuple specifying the padding in inches in a tight layout.
hspace= param.Number(allow_refs=False, default=0.5, inclusive_bounds=(True, True), label=’Hspace’, nested_refs=False, rx=<param.reactive.reactive_ops object at 0x7f6aec6e4150>)Specifies the space between horizontally adjacent elements in the grid. Default value is set conservatively to avoid overlap of subplots.
vspace= param.Number(allow_refs=False, default=0.3, inclusive_bounds=(True, True), label=’Vspace’, nested_refs=False, rx=<param.reactive.reactive_ops object at 0x7f6aec6e4950>)Specifies the space between vertically adjacent elements in the grid. Default value is set conservatively to avoid overlap of subplots.
- anim(start=0, stop=None, fps=30)[source]#
Method to return a matplotlib animation. The start and stop frames may be specified as well as the fps.
- compute_ranges(obj, key, ranges)[source]#
Given an object, a specific key, and the normalization options, this method will find the specified normalization options on the appropriate OptionTree, group the elements according to the selected normalization option (i.e. either per frame or over the whole animation) and finally compute the dimension ranges in each group. The new set of ranges is returned.
- grid_situate(current_idx, layout_type, subgrid_width)[source]#
Situate the current AdjointLayoutPlot in a LayoutPlot. The LayoutPlot specifies a layout_type into which the AdjointLayoutPlot must be embedded. This enclosing layout is guaranteed to have enough cells to display all the views.
Based on this enforced layout format, a starting index supplied by LayoutPlot (indexing into a large gridspec arrangement) is updated to the appropriate embedded value. It will also return a list of gridspec indices associated with the all the required layout axes.
- refresh(**kwargs)[source]#
Refreshes the plot by rerendering it and then pushing the updated data if the plot has an associated Comm.
- property state#
The plotting state that gets updated via the update method and used by the renderer to generate output.
- class holoviews.plotting.mpl.plot.MPLPlot(fig=None, axis=None, **params)[source]#
Bases:
DimensionedPlotAn MPLPlot object draws a matplotlib figure object when called or indexed but can also return a matplotlib animation object as appropriate. MPLPlots take element objects such as Image, Contours or Points as inputs and plots them in the appropriate format using matplotlib. As HoloMaps are supported, all plots support animation via the anim() method.
Parameters inherited from:
holoviews.plotting.plot.DimensionedPlot: fontsize, fontscale, show_title, title, normalizeprojection= param.Parameter(allow_None=True, allow_refs=False, label=’Projection’, nested_refs=False, rx=<param.reactive.reactive_ops object at 0x7f6aec6f8e10>)The projection of the plot axis, default of None is equivalent to 2D plot, ‘3d’ and ‘polar’ are also supported by matplotlib by default. May also supply a custom projection that is either a matplotlib projection type or implements the _as_mpl_axes method.
backend_opts= param.Dict(allow_refs=False, class_=<class ‘dict’>, default={}, label=’Backend opts’, nested_refs=False, rx=<param.reactive.reactive_ops object at 0x7f6aec6fa550>)A dictionary of custom options to apply to the plot or subcomponents of the plot. The keys in the dictionary mirror attribute access on the underlying models stored in the plot’s handles, e.g. {‘colorbar.margin’: 10} will index the colorbar in the Plot.handles and then set the margin to 10.
fig_alpha= param.Number(allow_refs=False, bounds=(0, 1), default=1.0, inclusive_bounds=(True, True), label=’Fig alpha’, nested_refs=False, rx=<param.reactive.reactive_ops object at 0x7f6aec6faa10>)Alpha of the overall figure background.
fig_bounds= param.NumericTuple(allow_refs=False, default=(0.15, 0.15, 0.85, 0.85), label=’Fig bounds’, length=4, nested_refs=False, rx=<param.reactive.reactive_ops object at 0x7f6aec6fa210>)The bounds of the overall figure as a 4-tuple of the form (left, bottom, right, top), defining the size of the border around the subplots.
fig_inches= param.Parameter(allow_refs=False, default=4, label=’Fig inches’, nested_refs=False, rx=<param.reactive.reactive_ops object at 0x7f6aec6f8290>)The overall matplotlib figure size in inches. May be set as an integer in which case it will be used to autocompute a size. Alternatively may be set with an explicit tuple or list, in which case it will be applied directly after being scaled by fig_size. If either the width or height is set to None, it will be computed automatically.
fig_latex= param.Boolean(allow_refs=False, default=False, label=’Fig latex’, nested_refs=False, rx=<param.reactive.reactive_ops object at 0x7f6aec6f9f10>)Whether to use LaTeX text in the overall figure.
fig_rcparams= param.Dict(allow_refs=False, class_=<class ‘dict’>, default={}, label=’Fig rcparams’, nested_refs=False, rx=<param.reactive.reactive_ops object at 0x7f6aec6f8e10>)matplotlib rc parameters to apply to the overall figure.
fig_size= param.Number(allow_refs=False, bounds=(1, None), default=100.0, inclusive_bounds=(True, True), label=’Fig size’, nested_refs=False, rx=<param.reactive.reactive_ops object at 0x7f6aec6fa790>)Size relative to the supplied overall fig_inches in percent.
initial_hooks= param.HookList(allow_refs=False, bounds=(0, None), default=[], label=’Initial hooks’, nested_refs=False, rx=<param.reactive.reactive_ops object at 0x7f6aec6f8290>)Optional list of hooks called before plotting the data onto the axis (now marked for deprecation). The hook is passed the plot object and the displayed object; other plotting handles can be accessed via plot.handles.
sublabel_format= param.String(allow_None=True, allow_refs=False, label=’Sublabel format’, nested_refs=False, rx=<param.reactive.reactive_ops object at 0x7f6aec6fa550>)Allows labeling the subaxes in each plot with various formatters including {Alpha}, {alpha}, {numeric} and {roman}.
sublabel_position= param.NumericTuple(allow_refs=False, default=(-0.35, 0.85), label=’Sublabel position’, length=2, nested_refs=False, rx=<param.reactive.reactive_ops object at 0x7f6aec6f8550>)Position relative to the plot for placing the optional subfigure label.
sublabel_size= param.Number(allow_refs=False, default=18, inclusive_bounds=(True, True), label=’Sublabel size’, nested_refs=False, rx=<param.reactive.reactive_ops object at 0x7f6aec6f8d10>)Size of optional subfigure label.
show_frame= param.Boolean(allow_refs=False, default=False, label=’Show frame’, nested_refs=False, rx=<param.reactive.reactive_ops object at 0x7f6aec6f8150>)Whether or not to show a complete frame around the plot.
- anim(start=0, stop=None, fps=30)[source]#
Method to return a matplotlib animation. The start and stop frames may be specified as well as the fps.
- compute_ranges(obj, key, ranges)[source]#
Given an object, a specific key, and the normalization options, this method will find the specified normalization options on the appropriate OptionTree, group the elements according to the selected normalization option (i.e. either per frame or over the whole animation) and finally compute the dimension ranges in each group. The new set of ranges is returned.
- refresh(**kwargs)[source]#
Refreshes the plot by rerendering it and then pushing the updated data if the plot has an associated Comm.
- property state#
The plotting state that gets updated via the update method and used by the renderer to generate output.
raster Module#

- class holoviews.plotting.mpl.raster.QuadMeshPlot(*args, **kwargs)[source]#
Bases:
ColorbarPlotParameters inherited from:
holoviews.plotting.plot.DimensionedPlot: fontsize, fontscale, show_title, title, normalizeholoviews.plotting.mpl.plot.MPLPlot: projection, backend_opts, fig_alpha, fig_bounds, fig_inches, fig_latex, fig_rcparams, fig_size, initial_hooks, sublabel_format, sublabel_position, sublabel_size, show_frameholoviews.plotting.plot.GenericElementPlot: apply_ranges, apply_extents, bgcolor, default_span, hooks, invert_axes, invert_xaxis, invert_yaxis, logx, logy, show_grid, xaxis, yaxis, xlabel, ylabel, xlim, ylim, zlim, xrotation, yrotation, xticks, yticksholoviews.plotting.mpl.element.ElementPlot: apply_ticks, aspect, data_aspect, invert_zaxis, labelled, logz, xformatter, yformatter, zformatter, zaxis, zlabel, zrotation, zticksholoviews.plotting.mpl.element.ColorbarPlot: clabel, clim, clim_percentile, cformatter, colorbar, colorbar_opts, color_levels, cnorm, cbar_padding, cbar_ticks, cbar_width, cbar_extend, rescale_discrete_levels, symmetricpadding= param.ClassSelector(allow_refs=False, class_=(<class ‘int’>, <class ‘float’>, <class ‘tuple’>), default=0, label=’Padding’, nested_refs=False, rx=<param.reactive.reactive_ops object at 0x7f6aec4d9350>)Fraction by which to increase auto-ranged extents to make datapoints more visible around borders. To compute padding, the axis whose screen size is largest is chosen, and the range of that axis is increased by the specified fraction along each axis. Other axes are then padded ensuring that the amount of screen space devoted to padding is equal for all axes. If specified as a tuple, the int or float values in the tuple will be used for padding in each axis, in order (x,y or x,y,z). For example, for padding=0.2 on a 800x800-pixel plot, an x-axis with the range [0,10] will be padded by 20% to be [-1,11], while a y-axis with a range [0,1000] will be padded to be [-100,1100], which should make the padding be approximately the same number of pixels. But if the same plot is changed to have a height of only 200, the y-range will then be [-400,1400] so that the y-axis padding will still match that of the x-axis. It is also possible to declare non-equal padding value for the lower and upper bound of an axis by supplying nested tuples, e.g. padding=(0.1, (0, 0.1)) will pad the x-axis lower and upper bound as well as the y-axis upper bound by a fraction of 0.1 while the y-axis lower bound is not padded at all.
show_legend= param.Boolean(allow_refs=False, default=False, label=’Show legend’, nested_refs=False, rx=<param.reactive.reactive_ops object at 0x7f6aec4daa50>)Whether to show legend for the plot.
clipping_colors= param.Dict(allow_refs=False, class_=<class ‘dict’>, default={‘NaN’: ‘transparent’}, label=’Clipping colors’, nested_refs=False, rx=<param.reactive.reactive_ops object at 0x7f6aec707cd0>)Dictionary to specify colors for clipped values, allows setting color for NaN values and for values above and below the min and max value. The min, max or NaN color may specify an RGB(A) color as a color hex string of the form #FFFFFF or #FFFFFFFF or a length 3 or length 4 tuple specifying values in the range 0-1 or a named HTML color.
nodata= param.Integer(allow_None=True, allow_refs=False, inclusive_bounds=(True, True), label=’Nodata’, nested_refs=False, rx=<param.reactive.reactive_ops object at 0x7f6aec62da10>)Optional missing-data value for integer data. If non-None, data with this value will be replaced with NaN so that it is transparent (by default) when plotted.
- anim(start=0, stop=None, fps=30)[source]#
Method to return a matplotlib animation. The start and stop frames may be specified as well as the fps.
- compute_ranges(obj, key, ranges)[source]#
Given an object, a specific key, and the normalization options, this method will find the specified normalization options on the appropriate OptionTree, group the elements according to the selected normalization option (i.e. either per frame or over the whole animation) and finally compute the dimension ranges in each group. The new set of ranges is returned.
- get_extents(element, ranges, range_type='combined', dimension=None, xdim=None, ydim=None, zdim=None, lims_as_soft_ranges=False, **kwargs)[source]#
Gets the extents for the axes from the current Element. The globally computed ranges can optionally override the extents.
The extents are computed by combining the data ranges, extents and dimension ranges. Each of these can be obtained individually by setting the range_type to one of:
‘data’: Just the data ranges
‘extents’: Element.extents
‘soft’: Dimension.soft_range values
‘hard’: Dimension.range values
To obtain the combined range, which includes range padding the default may be used:
‘combined’: All the range types combined and padding applied
This allows Overlay plots to obtain each range and combine them appropriately for all the objects in the overlay.
If lims_as_soft_ranges is set to True, the xlim and ylim will be treated as soft ranges instead of the default case as hard ranges while computing the extents. This is used e.g. when apply_hard_bounds is True and xlim/ylim is set, in which case we limit the initial viewable range to xlim/ylim, but allow navigation up to the abs max between the data range and xlim/ylim.
- get_padding(obj, extents)[source]#
Computes padding along the axes taking into account the plot aspect.
- get_zorder(overlay, key, el)[source]#
Computes the z-order of element in the NdOverlay taking into account possible batching of elements.
- init_artists(ax, plot_args, plot_kwargs)[source]#
Initializes the artist based on the plot method declared on the plot.
- refresh(**kwargs)[source]#
Refreshes the plot by rerendering it and then pushing the updated data if the plot has an associated Comm.
- property state#
The plotting state that gets updated via the update method and used by the renderer to generate output.
- teardown_handles()[source]#
If no custom update_handles method is supplied this method is called to tear down any previous handles before replacing them.
- traverse(fn=None, specs=None, full_breadth=True)[source]#
Traverses any nested DimensionedPlot returning a list of all plots that match the specs. The specs should be supplied as a list of either Plot types or callables, which should return a boolean given the plot class.
- update(key)[source]#
Update the internal state of the Plot to represent the given key tuple (where integers represent frames). Returns this state.
- class holoviews.plotting.mpl.raster.RGBPlot(element, **params)[source]#
Bases:
RasterBasePlot,LegendPlotParameters inherited from:
holoviews.plotting.plot.DimensionedPlot: fontsize, fontscale, show_title, title, normalizeholoviews.plotting.mpl.plot.MPLPlot: projection, backend_opts, fig_alpha, fig_bounds, fig_inches, fig_latex, fig_rcparams, fig_size, initial_hooks, sublabel_format, sublabel_position, sublabel_size, show_frameholoviews.plotting.plot.GenericElementPlot: apply_ranges, apply_extents, bgcolor, default_span, hooks, invert_axes, invert_xaxis, invert_yaxis, logx, logy, show_grid, xaxis, yaxis, xlabel, ylabel, xlim, ylim, zlim, xrotation, yrotation, xticks, yticksholoviews.plotting.mpl.element.ElementPlot: apply_ticks, data_aspect, invert_zaxis, labelled, logz, xformatter, yformatter, zformatter, zaxis, zlabel, zrotation, zticksholoviews.plotting.mpl.element.LegendPlot: legend_cols, legend_labels, legend_position, legend_optsholoviews.plotting.mpl.raster.RasterBasePlot: padding, show_legend, aspect, nodata, situate_axes- anim(start=0, stop=None, fps=30)[source]#
Method to return a matplotlib animation. The start and stop frames may be specified as well as the fps.
- compute_ranges(obj, key, ranges)[source]#
Given an object, a specific key, and the normalization options, this method will find the specified normalization options on the appropriate OptionTree, group the elements according to the selected normalization option (i.e. either per frame or over the whole animation) and finally compute the dimension ranges in each group. The new set of ranges is returned.
- get_extents(element, ranges, range_type='combined', **kwargs)[source]#
Gets the extents for the axes from the current Element. The globally computed ranges can optionally override the extents.
The extents are computed by combining the data ranges, extents and dimension ranges. Each of these can be obtained individually by setting the range_type to one of:
‘data’: Just the data ranges
‘extents’: Element.extents
‘soft’: Dimension.soft_range values
‘hard’: Dimension.range values
To obtain the combined range, which includes range padding the default may be used:
‘combined’: All the range types combined and padding applied
This allows Overlay plots to obtain each range and combine them appropriately for all the objects in the overlay.
If lims_as_soft_ranges is set to True, the xlim and ylim will be treated as soft ranges instead of the default case as hard ranges while computing the extents. This is used e.g. when apply_hard_bounds is True and xlim/ylim is set, in which case we limit the initial viewable range to xlim/ylim, but allow navigation up to the abs max between the data range and xlim/ylim.
- get_padding(obj, extents)[source]#
Computes padding along the axes taking into account the plot aspect.
- get_zorder(overlay, key, el)[source]#
Computes the z-order of element in the NdOverlay taking into account possible batching of elements.
- init_artists(ax, plot_args, plot_kwargs)[source]#
Initializes the artist based on the plot method declared on the plot.
- refresh(**kwargs)[source]#
Refreshes the plot by rerendering it and then pushing the updated data if the plot has an associated Comm.
- property state#
The plotting state that gets updated via the update method and used by the renderer to generate output.
- teardown_handles()[source]#
If no custom update_handles method is supplied this method is called to tear down any previous handles before replacing them.
- traverse(fn=None, specs=None, full_breadth=True)[source]#
Traverses any nested DimensionedPlot returning a list of all plots that match the specs. The specs should be supplied as a list of either Plot types or callables, which should return a boolean given the plot class.
- update(key)[source]#
Update the internal state of the Plot to represent the given key tuple (where integers represent frames). Returns this state.
- class holoviews.plotting.mpl.raster.RasterBasePlot(element, **params)[source]#
Bases:
ElementPlotParameters inherited from:
holoviews.plotting.plot.DimensionedPlot: fontsize, fontscale, show_title, title, normalizeholoviews.plotting.mpl.plot.MPLPlot: projection, backend_opts, fig_alpha, fig_bounds, fig_inches, fig_latex, fig_rcparams, fig_size, initial_hooks, sublabel_format, sublabel_position, sublabel_size, show_frameholoviews.plotting.plot.GenericElementPlot: apply_ranges, apply_extents, bgcolor, default_span, hooks, invert_axes, invert_xaxis, invert_yaxis, logx, logy, show_grid, xaxis, yaxis, xlabel, ylabel, xlim, ylim, zlim, xrotation, yrotation, xticks, yticksholoviews.plotting.mpl.element.ElementPlot: apply_ticks, data_aspect, invert_zaxis, labelled, logz, xformatter, yformatter, zformatter, zaxis, zlabel, zrotation, ztickspadding= param.ClassSelector(allow_refs=False, class_=(<class ‘int’>, <class ‘float’>, <class ‘tuple’>), default=0, label=’Padding’, nested_refs=False, rx=<param.reactive.reactive_ops object at 0x7f6aec520510>)Fraction by which to increase auto-ranged extents to make datapoints more visible around borders. To compute padding, the axis whose screen size is largest is chosen, and the range of that axis is increased by the specified fraction along each axis. Other axes are then padded ensuring that the amount of screen space devoted to padding is equal for all axes. If specified as a tuple, the int or float values in the tuple will be used for padding in each axis, in order (x,y or x,y,z). For example, for padding=0.2 on a 800x800-pixel plot, an x-axis with the range [0,10] will be padded by 20% to be [-1,11], while a y-axis with a range [0,1000] will be padded to be [-100,1100], which should make the padding be approximately the same number of pixels. But if the same plot is changed to have a height of only 200, the y-range will then be [-400,1400] so that the y-axis padding will still match that of the x-axis. It is also possible to declare non-equal padding value for the lower and upper bound of an axis by supplying nested tuples, e.g. padding=(0.1, (0, 0.1)) will pad the x-axis lower and upper bound as well as the y-axis upper bound by a fraction of 0.1 while the y-axis lower bound is not padded at all.
show_legend= param.Boolean(allow_refs=False, default=False, label=’Show legend’, nested_refs=False, rx=<param.reactive.reactive_ops object at 0x7f6aec521c10>)Whether to show legend for the plot.
aspect= param.Parameter(allow_refs=False, default=’equal’, label=’Aspect’, nested_refs=False, rx=<param.reactive.reactive_ops object at 0x7f6aec520890>)Raster elements respect the aspect ratio of the Images by default but may be set to an explicit aspect ratio or to ‘square’.
nodata= param.Integer(allow_None=True, allow_refs=False, inclusive_bounds=(True, True), label=’Nodata’, nested_refs=False, rx=<param.reactive.reactive_ops object at 0x7f6aec521e10>)Optional missing-data value for integer data. If non-None, data with this value will be replaced with NaN so that it is transparent (by default) when plotted.
situate_axes= param.Boolean(allow_refs=False, default=True, label=’Situate axes’, nested_refs=False, rx=<param.reactive.reactive_ops object at 0x7f6aec520510>)Whether to situate the image relative to other plots.
- anim(start=0, stop=None, fps=30)[source]#
Method to return a matplotlib animation. The start and stop frames may be specified as well as the fps.
- compute_ranges(obj, key, ranges)[source]#
Given an object, a specific key, and the normalization options, this method will find the specified normalization options on the appropriate OptionTree, group the elements according to the selected normalization option (i.e. either per frame or over the whole animation) and finally compute the dimension ranges in each group. The new set of ranges is returned.
- get_extents(element, ranges, range_type='combined', **kwargs)[source]#
Gets the extents for the axes from the current Element. The globally computed ranges can optionally override the extents.
The extents are computed by combining the data ranges, extents and dimension ranges. Each of these can be obtained individually by setting the range_type to one of:
‘data’: Just the data ranges
‘extents’: Element.extents
‘soft’: Dimension.soft_range values
‘hard’: Dimension.range values
To obtain the combined range, which includes range padding the default may be used:
‘combined’: All the range types combined and padding applied
This allows Overlay plots to obtain each range and combine them appropriately for all the objects in the overlay.
If lims_as_soft_ranges is set to True, the xlim and ylim will be treated as soft ranges instead of the default case as hard ranges while computing the extents. This is used e.g. when apply_hard_bounds is True and xlim/ylim is set, in which case we limit the initial viewable range to xlim/ylim, but allow navigation up to the abs max between the data range and xlim/ylim.
- get_padding(obj, extents)[source]#
Computes padding along the axes taking into account the plot aspect.
- get_zorder(overlay, key, el)[source]#
Computes the z-order of element in the NdOverlay taking into account possible batching of elements.
- init_artists(ax, plot_args, plot_kwargs)[source]#
Initializes the artist based on the plot method declared on the plot.
- refresh(**kwargs)[source]#
Refreshes the plot by rerendering it and then pushing the updated data if the plot has an associated Comm.
- property state#
The plotting state that gets updated via the update method and used by the renderer to generate output.
- teardown_handles()[source]#
If no custom update_handles method is supplied this method is called to tear down any previous handles before replacing them.
- traverse(fn=None, specs=None, full_breadth=True)[source]#
Traverses any nested DimensionedPlot returning a list of all plots that match the specs. The specs should be supplied as a list of either Plot types or callables, which should return a boolean given the plot class.
- update(key)[source]#
Update the internal state of the Plot to represent the given key tuple (where integers represent frames). Returns this state.
- class holoviews.plotting.mpl.raster.RasterGridPlot(layout, keys=None, dimensions=None, create_axes=False, ranges=None, layout_num=1, **params)[source]#
Bases:
GridPlot,OverlayPlotRasterGridPlot evenly spaces out plots of individual projections on a grid, even when they differ in size. Since this class uses a single axis to generate all the individual plots it is much faster than the equivalent using subplots.
Parameters inherited from:
holoviews.plotting.plot.DimensionedPlot: fontsize, fontscale, show_title, title, normalizeholoviews.plotting.mpl.plot.MPLPlot: projection, backend_opts, fig_alpha, fig_bounds, fig_inches, fig_latex, fig_rcparams, fig_size, initial_hooks, sublabel_format, sublabel_position, sublabel_size, show_frameholoviews.plotting.mpl.plot.CompositePlot: shared_axesholoviews.plotting.mpl.plot.GridPlot: aspect, shared_xaxis, shared_yaxis, show_legend, xaxis, yaxis, xrotation, yrotationapply_ranges= param.Parameter(allow_None=True, allow_refs=False, default=True, label=’Apply ranges’, nested_refs=False, rx=<param.reactive.reactive_ops object at 0x7f6aec53fe90>)Whether to compute the plot bounds from the data itself.
apply_extents= param.Parameter(allow_None=True, allow_refs=False, default=True, label=’Apply extents’, nested_refs=False, rx=<param.reactive.reactive_ops object at 0x7f6aec540b90>)Whether to apply extent overrides on the Elements
bgcolor= param.Parameter(allow_None=True, allow_refs=False, label=’Bgcolor’, nested_refs=False, rx=<param.reactive.reactive_ops object at 0x7f6aec53dcd0>)If set bgcolor overrides the background color of the axis.
default_span= param.Parameter(allow_None=True, allow_refs=False, default=2.0, label=’Default span’, nested_refs=False, rx=<param.reactive.reactive_ops object at 0x7f6aec540810>)Defines the span of an axis if the axis range is zero, i.e. if the lower and upper end of an axis are equal or no range is defined at all. For example if there is a single datapoint at 0 a default_span of 2.0 will result in axis ranges spanning from -1 to 1.
hooks= param.Parameter(allow_None=True, allow_refs=False, default=[], label=’Hooks’, nested_refs=False, rx=<param.reactive.reactive_ops object at 0x7f6aec53dcd0>)Optional list of hooks called when finalizing a plot. The hook is passed the plot object and the displayed element, and other plotting handles can be accessed via plot.handles.
invert_axes= param.Parameter(allow_None=True, allow_refs=False, default=False, label=’Invert axes’, nested_refs=False, rx=<param.reactive.reactive_ops object at 0x7f6aec541550>)Whether to invert the x- and y-axis
invert_xaxis= param.Parameter(allow_None=True, allow_refs=False, default=False, label=’Invert xaxis’, nested_refs=False, rx=<param.reactive.reactive_ops object at 0x7f6aec53dcd0>)Whether to invert the plot x-axis.
invert_yaxis= param.Parameter(allow_None=True, allow_refs=False, default=False, label=’Invert yaxis’, nested_refs=False, rx=<param.reactive.reactive_ops object at 0x7f6aec540a90>)Whether to invert the plot y-axis.
logx= param.Parameter(allow_None=True, allow_refs=False, default=False, label=’Logx’, nested_refs=False, rx=<param.reactive.reactive_ops object at 0x7f6aec53dcd0>)Whether the x-axis of the plot will be a log axis.
logy= param.Parameter(allow_None=True, allow_refs=False, default=False, label=’Logy’, nested_refs=False, rx=<param.reactive.reactive_ops object at 0x7f6aec541490>)Whether the y-axis of the plot will be a log axis.
padding= param.Number(allow_refs=False, default=0.1, inclusive_bounds=(True, True), label=’Padding’, nested_refs=False, rx=<param.reactive.reactive_ops object at 0x7f6aec541890>)The amount of padding as a fraction of the total Grid size
show_grid= param.Parameter(allow_None=True, allow_refs=False, default=False, label=’Show grid’, nested_refs=False, rx=<param.reactive.reactive_ops object at 0x7f6aec540c90>)Whether to show a Cartesian grid on the plot.
xlabel= param.Parameter(allow_None=True, allow_refs=False, label=’Xlabel’, nested_refs=False, rx=<param.reactive.reactive_ops object at 0x7f6aec53dcd0>)An explicit override of the x-axis label, if set takes precedence over the dimension label.
ylabel= param.Parameter(allow_None=True, allow_refs=False, label=’Ylabel’, nested_refs=False, rx=<param.reactive.reactive_ops object at 0x7f6aec541c10>)An explicit override of the y-axis label, if set takes precedence over the dimension label.
xlim= param.Parameter(allow_None=True, allow_refs=False, default=(nan, nan), label=’Xlim’, nested_refs=False, rx=<param.reactive.reactive_ops object at 0x7f6aec53dcd0>)User-specified x-axis range limits for the plot, as a tuple (low,high). If specified, takes precedence over data and dimension ranges.
ylim= param.Parameter(allow_None=True, allow_refs=False, default=(nan, nan), label=’Ylim’, nested_refs=False, rx=<param.reactive.reactive_ops object at 0x7f6aec541510>)User-specified y-axis range limits for the plot, as a tuple (low,high). If specified, takes precedence over data and dimension ranges.
zlim= param.Parameter(allow_None=True, allow_refs=False, default=(nan, nan), label=’Zlim’, nested_refs=False, rx=<param.reactive.reactive_ops object at 0x7f6aec53dcd0>)User-specified z-axis range limits for the plot, as a tuple (low,high). If specified, takes precedence over data and dimension ranges.
xticks= param.Parameter(allow_None=True, allow_refs=False, label=’Xticks’, nested_refs=False, rx=<param.reactive.reactive_ops object at 0x7f6aec540a90>)Ticks along x-axis specified as an integer, explicit list of tick locations, or bokeh Ticker object. If set to None default bokeh ticking behavior is applied.
yticks= param.Parameter(allow_None=True, allow_refs=False, label=’Yticks’, nested_refs=False, rx=<param.reactive.reactive_ops object at 0x7f6aec53dcd0>)Ticks along y-axis specified as an integer, explicit list of tick locations, or bokeh Ticker object. If set to None default bokeh ticking behavior is applied.
batched= param.Parameter(allow_None=True, allow_refs=False, default=True, label=’Batched’, nested_refs=False, rx=<param.reactive.reactive_ops object at 0x7f6aec540c90>)Whether to plot Elements NdOverlay in a batched plotting call if possible. Disables legends and zorder may not be preserved.
legend_limit= param.Parameter(allow_None=True, allow_refs=False, default=25, label=’Legend limit’, nested_refs=False, rx=<param.reactive.reactive_ops object at 0x7f6aec53dcd0>)Number of rendered glyphs before legends are disabled.
style_grouping= param.Parameter(allow_None=True, allow_refs=False, default=2, label=’Style grouping’, nested_refs=False, rx=<param.reactive.reactive_ops object at 0x7f6aec541c10>)The length of the type.group.label spec that will be used to group Elements into style groups. A style_grouping value of 1 will group just by type, a value of 2 will group by type and group, and a value of 3 will group by the full specification.
apply_ticks= param.Parameter(allow_None=True, allow_refs=False, default=True, label=’Apply ticks’, nested_refs=False, rx=<param.reactive.reactive_ops object at 0x7f6aec53dcd0>)Whether to apply custom ticks.
data_aspect= param.Parameter(allow_None=True, allow_refs=False, label=’Data aspect’, nested_refs=False, rx=<param.reactive.reactive_ops object at 0x7f6aec541510>)Defines the aspect of the axis scaling, i.e. the ratio of y-unit to x-unit.
invert_zaxis= param.Parameter(allow_None=True, allow_refs=False, default=False, label=’Invert zaxis’, nested_refs=False, rx=<param.reactive.reactive_ops object at 0x7f6aec53dcd0>)Whether to invert the plot z-axis.
labelled= param.Parameter(allow_None=True, allow_refs=False, default=[‘x’, ‘y’], label=’Labelled’, nested_refs=False, rx=<param.reactive.reactive_ops object at 0x7f6aec540810>)Whether to plot the ‘x’ and ‘y’ labels.
logz= param.Parameter(allow_None=True, allow_refs=False, default=False, label=’Logz’, nested_refs=False, rx=<param.reactive.reactive_ops object at 0x7f6aec53dcd0>)Whether to apply log scaling to the y-axis of the Chart.
xformatter= param.Parameter(allow_None=True, allow_refs=False, label=’Xformatter’, nested_refs=False, rx=<param.reactive.reactive_ops object at 0x7f6aec540a90>)Formatter for ticks along the x-axis.
yformatter= param.Parameter(allow_None=True, allow_refs=False, label=’Yformatter’, nested_refs=False, rx=<param.reactive.reactive_ops object at 0x7f6aec53dcd0>)Formatter for ticks along the y-axis.
zformatter= param.Parameter(allow_None=True, allow_refs=False, label=’Zformatter’, nested_refs=False, rx=<param.reactive.reactive_ops object at 0x7f6aec540c90>)Formatter for ticks along the z-axis.
zaxis= param.Parameter(allow_None=True, allow_refs=False, default=True, label=’Zaxis’, nested_refs=False, rx=<param.reactive.reactive_ops object at 0x7f6aec53dcd0>)Whether to display the z-axis.
zlabel= param.Parameter(allow_None=True, allow_refs=False, label=’Zlabel’, nested_refs=False, rx=<param.reactive.reactive_ops object at 0x7f6aec541510>)An explicit override of the z-axis label, if set takes precedence over the dimension label.
zrotation= param.Parameter(allow_None=True, allow_refs=False, default=0, label=’Zrotation’, nested_refs=False, rx=<param.reactive.reactive_ops object at 0x7f6aec53dcd0>)Rotation angle of the zticks.
zticks= param.Parameter(allow_None=True, allow_refs=False, label=’Zticks’, nested_refs=False, rx=<param.reactive.reactive_ops object at 0x7f6aec540810>)Ticks along z-axis specified as an integer, explicit list of tick locations, list of tuples containing the locations and labels or a matplotlib tick locator object. If set to None default matplotlib ticking behavior is applied.
legend_cols= param.Parameter(allow_None=True, allow_refs=False, label=’Legend cols’, nested_refs=False, rx=<param.reactive.reactive_ops object at 0x7f6aec53dcd0>)Number of legend columns in the legend.
legend_labels= param.Parameter(allow_None=True, allow_refs=False, default={}, label=’Legend labels’, nested_refs=False, rx=<param.reactive.reactive_ops object at 0x7f6aec540a90>)A mapping that allows overriding legend labels.
legend_position= param.Parameter(allow_None=True, allow_refs=False, default=’inner’, label=’Legend position’, nested_refs=False, rx=<param.reactive.reactive_ops object at 0x7f6aec53dcd0>)Allows selecting between a number of predefined legend position options. The predefined options may be customized in the legend_specs class attribute. By default, ‘inner’, ‘right’, ‘bottom’, ‘top’, ‘left’, ‘best’, ‘top_right’, ‘top_left’, ‘bottom_right’ and ‘bottom_left’ are supported.
legend_opts= param.Parameter(allow_None=True, allow_refs=False, default={}, label=’Legend opts’, nested_refs=False, rx=<param.reactive.reactive_ops object at 0x7f6aec540c90>)Allows setting specific styling options for the colorbar.
- anim(start=0, stop=None, fps=30)[source]#
Method to return a matplotlib animation. The start and stop frames may be specified as well as the fps.
- compute_ranges(obj, key, ranges)[source]#
Given an object, a specific key, and the normalization options, this method will find the specified normalization options on the appropriate OptionTree, group the elements according to the selected normalization option (i.e. either per frame or over the whole animation) and finally compute the dimension ranges in each group. The new set of ranges is returned.
- get_extents(view, ranges, range_type='combined', **kwargs)[source]#
Gets the extents for the axes from the current Element. The globally computed ranges can optionally override the extents.
The extents are computed by combining the data ranges, extents and dimension ranges. Each of these can be obtained individually by setting the range_type to one of:
‘data’: Just the data ranges
‘extents’: Element.extents
‘soft’: Dimension.soft_range values
‘hard’: Dimension.range values
To obtain the combined range, which includes range padding the default may be used:
‘combined’: All the range types combined and padding applied
This allows Overlay plots to obtain each range and combine them appropriately for all the objects in the overlay.
If lims_as_soft_ranges is set to True, the xlim and ylim will be treated as soft ranges instead of the default case as hard ranges while computing the extents. This is used e.g. when apply_hard_bounds is True and xlim/ylim is set, in which case we limit the initial viewable range to xlim/ylim, but allow navigation up to the abs max between the data range and xlim/ylim.
- get_padding(obj, extents)[source]#
Computes padding along the axes taking into account the plot aspect.
- get_zorder(overlay, key, el)[source]#
Computes the z-order of element in the NdOverlay taking into account possible batching of elements.
- init_artists(ax, plot_args, plot_kwargs)[source]#
Initializes the artist based on the plot method declared on the plot.
- refresh(**kwargs)[source]#
Refreshes the plot by rerendering it and then pushing the updated data if the plot has an associated Comm.
- property state#
The plotting state that gets updated via the update method and used by the renderer to generate output.
- teardown_handles()[source]#
If no custom update_handles method is supplied this method is called to tear down any previous handles before replacing them.
- traverse(fn=None, specs=None, full_breadth=True)[source]#
Traverses any nested DimensionedPlot returning a list of all plots that match the specs. The specs should be supplied as a list of either Plot types or callables, which should return a boolean given the plot class.
- update(key)[source]#
Update the internal state of the Plot to represent the given key tuple (where integers represent frames). Returns this state.
- class holoviews.plotting.mpl.raster.RasterPlot(*args, **kwargs)[source]#
Bases:
RasterBasePlot,ColorbarPlotParameters inherited from:
holoviews.plotting.plot.DimensionedPlot: fontsize, fontscale, show_title, title, normalizeholoviews.plotting.mpl.plot.MPLPlot: projection, backend_opts, fig_alpha, fig_bounds, fig_inches, fig_latex, fig_rcparams, fig_size, initial_hooks, sublabel_format, sublabel_position, sublabel_size, show_frameholoviews.plotting.plot.GenericElementPlot: apply_ranges, apply_extents, bgcolor, default_span, hooks, invert_axes, invert_xaxis, invert_yaxis, logx, logy, show_grid, xaxis, yaxis, xlabel, ylabel, xlim, ylim, zlim, xrotation, yrotation, xticks, yticksholoviews.plotting.mpl.element.ElementPlot: apply_ticks, data_aspect, invert_zaxis, labelled, logz, xformatter, yformatter, zformatter, zaxis, zlabel, zrotation, zticksholoviews.plotting.mpl.element.ColorbarPlot: clabel, clim, clim_percentile, cformatter, colorbar, colorbar_opts, color_levels, cnorm, cbar_padding, cbar_ticks, cbar_width, cbar_extend, rescale_discrete_levels, symmetricholoviews.plotting.mpl.raster.RasterBasePlot: padding, show_legend, aspect, nodata, situate_axesclipping_colors= param.Dict(allow_refs=False, class_=<class ‘dict’>, default={‘NaN’: ‘transparent’}, label=’Clipping colors’, nested_refs=False, rx=<param.reactive.reactive_ops object at 0x7f6aec564510>)Dictionary to specify colors for clipped values, allows setting color for NaN values and for values above and below the min and max value. The min, max or NaN color may specify an RGB(A) color as a color hex string of the form #FFFFFF or #FFFFFFFF or a length 3 or length 4 tuple specifying values in the range 0-1 or a named HTML color.
- anim(start=0, stop=None, fps=30)[source]#
Method to return a matplotlib animation. The start and stop frames may be specified as well as the fps.
- compute_ranges(obj, key, ranges)[source]#
Given an object, a specific key, and the normalization options, this method will find the specified normalization options on the appropriate OptionTree, group the elements according to the selected normalization option (i.e. either per frame or over the whole animation) and finally compute the dimension ranges in each group. The new set of ranges is returned.
- get_extents(element, ranges, range_type='combined', **kwargs)[source]#
Gets the extents for the axes from the current Element. The globally computed ranges can optionally override the extents.
The extents are computed by combining the data ranges, extents and dimension ranges. Each of these can be obtained individually by setting the range_type to one of:
‘data’: Just the data ranges
‘extents’: Element.extents
‘soft’: Dimension.soft_range values
‘hard’: Dimension.range values
To obtain the combined range, which includes range padding the default may be used:
‘combined’: All the range types combined and padding applied
This allows Overlay plots to obtain each range and combine them appropriately for all the objects in the overlay.
If lims_as_soft_ranges is set to True, the xlim and ylim will be treated as soft ranges instead of the default case as hard ranges while computing the extents. This is used e.g. when apply_hard_bounds is True and xlim/ylim is set, in which case we limit the initial viewable range to xlim/ylim, but allow navigation up to the abs max between the data range and xlim/ylim.
- get_padding(obj, extents)[source]#
Computes padding along the axes taking into account the plot aspect.
- get_zorder(overlay, key, el)[source]#
Computes the z-order of element in the NdOverlay taking into account possible batching of elements.
- init_artists(ax, plot_args, plot_kwargs)[source]#
Initializes the artist based on the plot method declared on the plot.
- refresh(**kwargs)[source]#
Refreshes the plot by rerendering it and then pushing the updated data if the plot has an associated Comm.
- property state#
The plotting state that gets updated via the update method and used by the renderer to generate output.
- teardown_handles()[source]#
If no custom update_handles method is supplied this method is called to tear down any previous handles before replacing them.
- traverse(fn=None, specs=None, full_breadth=True)[source]#
Traverses any nested DimensionedPlot returning a list of all plots that match the specs. The specs should be supplied as a list of either Plot types or callables, which should return a boolean given the plot class.
- update(key)[source]#
Update the internal state of the Plot to represent the given key tuple (where integers represent frames). Returns this state.
renderer Module#

- class holoviews.plotting.mpl.renderer.MPLRenderer(*, interactive, backend, center, css, dpi, fig, fps, holomap, mode, post_render_hooks, size, widget_location, widget_mode, info_fn, key_fn, name)[source]#
Bases:
RendererExporter used to render data from matplotlib, either to a stream or directly to file.
The __call__ method renders an HoloViews component to raw data of a specified matplotlib format. The save method is the corresponding method for saving a HoloViews objects to disk.
The save_fig and save_anim methods are used to save matplotlib figure and animation objects. These match the two primary return types of plotting class implemented with matplotlib.
Parameters inherited from:
holoviews.plotting.renderer.Renderer: key_fn, info_fn, center, fps, size, widget_location, widget_mode, css, post_render_hooksbackend= param.String(allow_refs=False, default=’matplotlib’, label=’Backend’, nested_refs=False, rx=<param.reactive.reactive_ops object at 0x7f6aec91d7d0>)The backend name.
dpi= param.Integer(allow_refs=False, default=72, inclusive_bounds=(True, True), label=’Dpi’, nested_refs=False, rx=<param.reactive.reactive_ops object at 0x7f6aecb70190>)The render resolution in dpi (dots per inch)
fig= param.ObjectSelector(allow_refs=False, default=’auto’, label=’Fig’, names={}, nested_refs=False, objects=[‘png’, ‘svg’, ‘pdf’, ‘pgf’, ‘html’, None, ‘auto’], rx=<param.reactive.reactive_ops object at 0x7f6aecb75ed0>)Output render format for static figures. If None, no figure rendering will occur.
holomap= param.ObjectSelector(allow_refs=False, default=’auto’, label=’Holomap’, names={}, nested_refs=False, objects=[‘widgets’, ‘scrubber’, ‘webm’, ‘mp4’, ‘gif’, None, ‘auto’], rx=<param.reactive.reactive_ops object at 0x7f6aec88c950>)Output render multi-frame (typically animated) format. If None, no multi-frame rendering will occur.
mode= param.ObjectSelector(allow_refs=False, default=’default’, label=’Mode’, names={}, nested_refs=False, objects=[‘default’], rx=<param.reactive.reactive_ops object at 0x7f6aec91cd90>)Whether to render the object in regular or server mode. In server mode a bokeh Document will be returned which can be served as a bokeh server app. By default renders all output is rendered to HTML.
interactive= param.Boolean(allow_refs=False, default=False, label=’Interactive’, nested_refs=False, rx=<param.reactive.reactive_ops object at 0x7f6aec88c250>)Whether to enable interactive plotting allowing interactive plotting with explicitly calling show.
- classmethod app(plot, show=False, new_window=False, websocket_origin=None, port=0)[source]#
Creates a bokeh app from a HoloViews object or plot. By default simply attaches the plot to bokeh’s curdoc and returns the Document, if show option is supplied creates an Application instance and displays it either in a browser window or inline if notebook extension has been loaded. Using the new_window option the app may be displayed in a new browser tab once the notebook extension has been loaded. A websocket origin is required when launching from an existing tornado server (such as the notebook) and it is not on the default port (‘localhost:8888’).
- components(obj, fmt=None, comm=True, **kwargs)[source]#
Returns data and metadata dictionaries containing HTML and JS components to include render in app, notebook, or standalone document.
- classmethod encode(entry)[source]#
Classmethod that applies conditional encoding based on mime-type. Given an entry as returned by __call__ return the data in the appropriate encoding.
- classmethod export_widgets(obj, filename, fmt=None, template=None, json=False, json_path='', **kwargs)[source]#
Render and export object as a widget to a static HTML file. Allows supplying a custom template formatting string with fields to interpolate ‘js’, ‘css’ and the main ‘html’ containing the widget. Also provides options to export widget data to a json file in the supplied json_path (defaults to current path).
- classmethod get_plot(obj, doc=None, renderer=None, comm=None, **kwargs)[source]#
Given a HoloViews Viewable return a corresponding plot instance.
- classmethod get_plot_state(obj, renderer=None, **kwargs)[source]#
Given a HoloViews Viewable return a corresponding plot state.
- get_size(plot)[source]#
Return the display size associated with a plot before rendering to any particular format. Used to generate appropriate HTML display.
Returns a tuple of (width, height) in pixels.
- html(obj, fmt=None, css=None, resources='CDN', **kwargs)[source]#
Renders plot or data structure and wraps the output in HTML. The comm argument defines whether the HTML output includes code to initialize a Comm, if the plot supplies one.
- classmethod instance(**params)[source]#
Return an instance of this class, copying parameters from any existing instance provided.
- classmethod plot_options(obj, percent_size)[source]#
Given a holoviews object and a percentage size, apply heuristics to compute a suitable figure size. For instance, scaling layouts and grids linearly can result in unwieldy figure sizes when there are a large number of elements. As ad hoc heuristics are used, this functionality is kept separate from the plotting classes themselves.
Used by the IPython Notebook display hooks and the save utility. Note that this can be overridden explicitly per object using the fig_size and size plot options.
- classmethod plotting_class(obj)[source]#
Given an object or Element class, return the suitable plotting class needed to render it with the current renderer.
- classmethod save(obj, basename, fmt='auto', key=None, info=None, options=None, resources='inline', title=None, **kwargs)[source]#
Save a HoloViews object to file, either using an explicitly supplied format or to the appropriate default.
- classmethod server_doc(obj, doc=None)[source]#
Get a bokeh Document with the plot attached. May supply an existing doc, otherwise bokeh.io.curdoc() is used to attach the plot to the global document instance.
- classmethod state()[source]#
Context manager to handle global state for a backend, allowing Plot classes to temporarily override that state.
sankey Module#

- class holoviews.plotting.mpl.sankey.SankeyPlot(*args, **kwargs)[source]#
Bases:
GraphPlotParameters inherited from:
holoviews.plotting.plot.DimensionedPlot: fontsize, fontscale, show_title, title, normalizeholoviews.plotting.mpl.plot.MPLPlot: projection, backend_opts, fig_alpha, fig_bounds, fig_inches, fig_latex, fig_rcparams, fig_size, initial_hooks, sublabel_format, sublabel_position, sublabel_size, show_frameholoviews.plotting.plot.GenericElementPlot: apply_ranges, apply_extents, bgcolor, default_span, hooks, invert_axes, invert_xaxis, invert_yaxis, logx, logy, padding, show_legend, show_grid, xaxis, yaxis, xlabel, ylabel, xlim, ylim, zlim, xrotation, yrotation, xticks, yticksholoviews.plotting.mpl.element.ElementPlot: apply_ticks, aspect, data_aspect, invert_zaxis, labelled, logz, xformatter, yformatter, zformatter, zaxis, zlabel, zrotation, zticksholoviews.plotting.mpl.element.ColorbarPlot: clabel, clim, clim_percentile, cformatter, colorbar, colorbar_opts, color_levels, cnorm, clipping_colors, cbar_padding, cbar_ticks, cbar_width, cbar_extend, rescale_discrete_levels, symmetricholoviews.plotting.mpl.graphs.GraphPlot: arrowhead_length, directed, edge_color_indexcolor_index= param.ClassSelector(allow_None=True, allow_refs=False, class_=(<class ‘str’>, <class ‘int’>), default=2, label=’Color index’, nested_refs=False, rx=<param.reactive.reactive_ops object at 0x7f6aecee0550>)Index of the dimension from which the node labels will be drawn
labels= param.ClassSelector(allow_None=True, allow_refs=False, class_=(<class ‘str’>, <class ‘holoviews.util.transform.dim’>), label=’Labels’, nested_refs=False, rx=<param.reactive.reactive_ops object at 0x7f6aed0d3550>)The dimension or dimension value transform used to draw labels from.
show_values= param.Boolean(allow_refs=False, default=True, label=’Show values’, nested_refs=False, rx=<param.reactive.reactive_ops object at 0x7f6aecee0950>)Whether to show the values.
label_position= param.ObjectSelector(allow_refs=False, default=’right’, label=’Label position’, names={}, nested_refs=False, objects=[‘left’, ‘right’], rx=<param.reactive.reactive_ops object at 0x7f6aed0d1010>)Whether node labels should be placed to the left or right.
node_width= param.Number(allow_refs=False, default=15, inclusive_bounds=(True, True), label=’Node width’, nested_refs=False, rx=<param.reactive.reactive_ops object at 0x7f6aed0d3b90>)Width of the nodes.
node_padding= param.Integer(allow_None=True, allow_refs=False, inclusive_bounds=(True, True), label=’Node padding’, nested_refs=False, rx=<param.reactive.reactive_ops object at 0x7f6aecee6950>)Number of pixels of padding relative to the bounds.
iterations= param.Integer(allow_refs=False, default=32, inclusive_bounds=(True, True), label=’Iterations’, nested_refs=False, rx=<param.reactive.reactive_ops object at 0x7f6aed0d3cd0>)Number of iterations to run the layout algorithm.
node_sort= param.Boolean(allow_refs=False, default=True, label=’Node sort’, nested_refs=False, rx=<param.reactive.reactive_ops object at 0x7f6aed0d08d0>)Sort nodes in ascending breadth.
label_index= param.ClassSelector(allow_None=True, allow_refs=False, class_=(<class ‘str’>, <class ‘int’>), default=2, label=’Label index’, nested_refs=False, rx=<param.reactive.reactive_ops object at 0x7f6aecee05d0>)Index of the dimension from which the node labels will be drawn
- anim(start=0, stop=None, fps=30)[source]#
Method to return a matplotlib animation. The start and stop frames may be specified as well as the fps.
- compute_ranges(obj, key, ranges)[source]#
Given an object, a specific key, and the normalization options, this method will find the specified normalization options on the appropriate OptionTree, group the elements according to the selected normalization option (i.e. either per frame or over the whole animation) and finally compute the dimension ranges in each group. The new set of ranges is returned.
- get_extents(element, ranges, range_type='combined', **kwargs)[source]#
A Chord plot is always drawn on a unit circle.
- get_padding(obj, extents)[source]#
Computes padding along the axes taking into account the plot aspect.
- get_zorder(overlay, key, el)[source]#
Computes the z-order of element in the NdOverlay taking into account possible batching of elements.
- init_artists(ax, plot_args, plot_kwargs)[source]#
Initializes the artist based on the plot method declared on the plot.
- refresh(**kwargs)[source]#
Refreshes the plot by rerendering it and then pushing the updated data if the plot has an associated Comm.
- property state#
The plotting state that gets updated via the update method and used by the renderer to generate output.
- teardown_handles()[source]#
If no custom update_handles method is supplied this method is called to tear down any previous handles before replacing them.
- traverse(fn=None, specs=None, full_breadth=True)[source]#
Traverses any nested DimensionedPlot returning a list of all plots that match the specs. The specs should be supplied as a list of either Plot types or callables, which should return a boolean given the plot class.
- update(key)[source]#
Update the internal state of the Plot to represent the given key tuple (where integers represent frames). Returns this state.
stats Module#

- class holoviews.plotting.mpl.stats.BivariatePlot(*args, **kwargs)[source]#
Bases:
PolygonPlotBivariate plot visualizes two-dimensional kernel density estimates. Additionally, by enabling the joint option, the marginals distributions can be plotted alongside each axis (does not animate or compose).
Parameters inherited from:
holoviews.plotting.plot.DimensionedPlot: fontsize, fontscale, show_title, title, normalizeholoviews.plotting.mpl.plot.MPLPlot: projection, backend_opts, fig_alpha, fig_bounds, fig_inches, fig_latex, fig_rcparams, fig_size, initial_hooks, sublabel_format, sublabel_position, sublabel_size, show_frameholoviews.plotting.plot.GenericElementPlot: apply_ranges, apply_extents, bgcolor, default_span, hooks, invert_axes, invert_xaxis, invert_yaxis, logx, logy, padding, show_grid, xaxis, yaxis, xlabel, ylabel, xlim, ylim, zlim, xrotation, yrotation, xticks, yticksholoviews.plotting.mpl.element.ElementPlot: apply_ticks, data_aspect, invert_zaxis, labelled, logz, xformatter, yformatter, zformatter, zaxis, zlabel, zrotation, zticksholoviews.plotting.mpl.element.ColorbarPlot: clabel, clim, clim_percentile, cformatter, colorbar, colorbar_opts, color_levels, cnorm, clipping_colors, cbar_padding, cbar_ticks, cbar_width, cbar_extend, rescale_discrete_levels, symmetricholoviews.plotting.mpl.path.PathPlot: aspectholoviews.plotting.mpl.path.ContourPlot: color_indexholoviews.plotting.mpl.path.PolygonPlot: show_legendbandwidth= param.Number(allow_None=True, allow_refs=False, inclusive_bounds=(True, True), label=’Bandwidth’, nested_refs=False, rx=<param.reactive.reactive_ops object at 0x7f6aed39d890>)The bandwidth of the kernel for the density estimate.
cut= param.Number(allow_refs=False, default=3, inclusive_bounds=(True, True), label=’Cut’, nested_refs=False, rx=<param.reactive.reactive_ops object at 0x7f6aed54f090>)Draw the estimate to cut * bw from the extreme data points.
filled= param.Boolean(allow_refs=False, default=False, label=’Filled’, nested_refs=False, rx=<param.reactive.reactive_ops object at 0x7f6aed39cb10>)Whether the bivariate contours should be filled.
levels= param.ClassSelector(allow_refs=False, class_=(<class ‘list’>, <class ‘int’>), default=10, label=’Levels’, nested_refs=False, rx=<param.reactive.reactive_ops object at 0x7f6aed39e750>)A list of scalar values used to specify the contour levels.
- anim(start=0, stop=None, fps=30)[source]#
Method to return a matplotlib animation. The start and stop frames may be specified as well as the fps.
- compute_ranges(obj, key, ranges)[source]#
Given an object, a specific key, and the normalization options, this method will find the specified normalization options on the appropriate OptionTree, group the elements according to the selected normalization option (i.e. either per frame or over the whole animation) and finally compute the dimension ranges in each group. The new set of ranges is returned.
- get_extents(element, ranges, range_type='combined', dimension=None, xdim=None, ydim=None, zdim=None, lims_as_soft_ranges=False, **kwargs)[source]#
Gets the extents for the axes from the current Element. The globally computed ranges can optionally override the extents.
The extents are computed by combining the data ranges, extents and dimension ranges. Each of these can be obtained individually by setting the range_type to one of:
‘data’: Just the data ranges
‘extents’: Element.extents
‘soft’: Dimension.soft_range values
‘hard’: Dimension.range values
To obtain the combined range, which includes range padding the default may be used:
‘combined’: All the range types combined and padding applied
This allows Overlay plots to obtain each range and combine them appropriately for all the objects in the overlay.
If lims_as_soft_ranges is set to True, the xlim and ylim will be treated as soft ranges instead of the default case as hard ranges while computing the extents. This is used e.g. when apply_hard_bounds is True and xlim/ylim is set, in which case we limit the initial viewable range to xlim/ylim, but allow navigation up to the abs max between the data range and xlim/ylim.
- get_padding(obj, extents)[source]#
Computes padding along the axes taking into account the plot aspect.
- get_zorder(overlay, key, el)[source]#
Computes the z-order of element in the NdOverlay taking into account possible batching of elements.
- init_artists(ax, plot_args, plot_kwargs)[source]#
Initializes the artist based on the plot method declared on the plot.
- refresh(**kwargs)[source]#
Refreshes the plot by rerendering it and then pushing the updated data if the plot has an associated Comm.
- property state#
The plotting state that gets updated via the update method and used by the renderer to generate output.
- teardown_handles()[source]#
If no custom update_handles method is supplied this method is called to tear down any previous handles before replacing them.
- traverse(fn=None, specs=None, full_breadth=True)[source]#
Traverses any nested DimensionedPlot returning a list of all plots that match the specs. The specs should be supplied as a list of either Plot types or callables, which should return a boolean given the plot class.
- update(key)[source]#
Update the internal state of the Plot to represent the given key tuple (where integers represent frames). Returns this state.
- class holoviews.plotting.mpl.stats.BoxPlot(element, **params)[source]#
Bases:
MultiDistributionMixin,ChartPlotBoxPlot plots the ErrorBar Element type and supporting both horizontal and vertical error bars via the ‘horizontal’ plot option.
Parameters inherited from:
holoviews.plotting.plot.DimensionedPlot: fontsize, fontscale, show_title, title, normalizeholoviews.plotting.mpl.plot.MPLPlot: projection, backend_opts, fig_alpha, fig_bounds, fig_inches, fig_latex, fig_rcparams, fig_size, initial_hooks, sublabel_format, sublabel_position, sublabel_size, show_frameholoviews.plotting.plot.GenericElementPlot: apply_ranges, apply_extents, bgcolor, default_span, hooks, invert_axes, invert_xaxis, invert_yaxis, logx, logy, padding, show_legend, show_grid, xaxis, yaxis, xlabel, ylabel, xlim, ylim, zlim, xrotation, yrotation, xticks, yticksholoviews.plotting.mpl.element.ElementPlot: apply_ticks, aspect, data_aspect, invert_zaxis, labelled, logz, xformatter, yformatter, zformatter, zaxis, zlabel, zrotation, zticks- anim(start=0, stop=None, fps=30)[source]#
Method to return a matplotlib animation. The start and stop frames may be specified as well as the fps.
- compute_ranges(obj, key, ranges)[source]#
Given an object, a specific key, and the normalization options, this method will find the specified normalization options on the appropriate OptionTree, group the elements according to the selected normalization option (i.e. either per frame or over the whole animation) and finally compute the dimension ranges in each group. The new set of ranges is returned.
- get_extents(element, ranges, range_type='combined', **kwargs)[source]#
Gets the extents for the axes from the current Element. The globally computed ranges can optionally override the extents.
The extents are computed by combining the data ranges, extents and dimension ranges. Each of these can be obtained individually by setting the range_type to one of:
‘data’: Just the data ranges
‘extents’: Element.extents
‘soft’: Dimension.soft_range values
‘hard’: Dimension.range values
To obtain the combined range, which includes range padding the default may be used:
‘combined’: All the range types combined and padding applied
This allows Overlay plots to obtain each range and combine them appropriately for all the objects in the overlay.
If lims_as_soft_ranges is set to True, the xlim and ylim will be treated as soft ranges instead of the default case as hard ranges while computing the extents. This is used e.g. when apply_hard_bounds is True and xlim/ylim is set, in which case we limit the initial viewable range to xlim/ylim, but allow navigation up to the abs max between the data range and xlim/ylim.
- get_padding(obj, extents)[source]#
Computes padding along the axes taking into account the plot aspect.
- get_zorder(overlay, key, el)[source]#
Computes the z-order of element in the NdOverlay taking into account possible batching of elements.
- init_artists(ax, plot_args, plot_kwargs)[source]#
Initializes the artist based on the plot method declared on the plot.
- refresh(**kwargs)[source]#
Refreshes the plot by rerendering it and then pushing the updated data if the plot has an associated Comm.
- property state#
The plotting state that gets updated via the update method and used by the renderer to generate output.
- teardown_handles()[source]#
If no custom update_handles method is supplied this method is called to tear down any previous handles before replacing them.
- traverse(fn=None, specs=None, full_breadth=True)[source]#
Traverses any nested DimensionedPlot returning a list of all plots that match the specs. The specs should be supplied as a list of either Plot types or callables, which should return a boolean given the plot class.
- update(key)[source]#
Update the internal state of the Plot to represent the given key tuple (where integers represent frames). Returns this state.
- class holoviews.plotting.mpl.stats.DistributionPlot(element, **params)[source]#
Bases:
AreaPlotDistributionPlot visualizes a distribution of values as a KDE.
Parameters inherited from:
holoviews.plotting.plot.DimensionedPlot: fontsize, fontscale, show_title, title, normalizeholoviews.plotting.mpl.plot.MPLPlot: projection, backend_opts, fig_alpha, fig_bounds, fig_inches, fig_latex, fig_rcparams, fig_size, initial_hooks, sublabel_format, sublabel_position, sublabel_size, show_frameholoviews.plotting.plot.GenericElementPlot: apply_ranges, apply_extents, bgcolor, default_span, hooks, invert_axes, invert_xaxis, invert_yaxis, logx, logy, show_grid, xaxis, yaxis, xlabel, ylabel, xlim, ylim, zlim, xrotation, yrotation, xticks, yticksholoviews.plotting.mpl.element.ElementPlot: apply_ticks, aspect, data_aspect, invert_zaxis, labelled, logz, xformatter, yformatter, zformatter, zaxis, zlabel, zrotation, zticksholoviews.plotting.mpl.chart.AreaPlot: padding, show_legendbandwidth= param.Number(allow_None=True, allow_refs=False, inclusive_bounds=(True, True), label=’Bandwidth’, nested_refs=False, rx=<param.reactive.reactive_ops object at 0x7f6aece249d0>)The bandwidth of the kernel for the density estimate.
cut= param.Number(allow_refs=False, default=3, inclusive_bounds=(True, True), label=’Cut’, nested_refs=False, rx=<param.reactive.reactive_ops object at 0x7f6aed12a710>)Draw the estimate to cut * bw from the extreme data points.
filled= param.Boolean(allow_refs=False, default=True, label=’Filled’, nested_refs=False, rx=<param.reactive.reactive_ops object at 0x7f6aed26bfd0>)Whether the bivariate contours should be filled.
- anim(start=0, stop=None, fps=30)[source]#
Method to return a matplotlib animation. The start and stop frames may be specified as well as the fps.
- compute_ranges(obj, key, ranges)[source]#
Given an object, a specific key, and the normalization options, this method will find the specified normalization options on the appropriate OptionTree, group the elements according to the selected normalization option (i.e. either per frame or over the whole animation) and finally compute the dimension ranges in each group. The new set of ranges is returned.
- get_extents(element, ranges, range_type='combined', **kwargs)[source]#
Gets the extents for the axes from the current Element. The globally computed ranges can optionally override the extents.
The extents are computed by combining the data ranges, extents and dimension ranges. Each of these can be obtained individually by setting the range_type to one of:
‘data’: Just the data ranges
‘extents’: Element.extents
‘soft’: Dimension.soft_range values
‘hard’: Dimension.range values
To obtain the combined range, which includes range padding the default may be used:
‘combined’: All the range types combined and padding applied
This allows Overlay plots to obtain each range and combine them appropriately for all the objects in the overlay.
If lims_as_soft_ranges is set to True, the xlim and ylim will be treated as soft ranges instead of the default case as hard ranges while computing the extents. This is used e.g. when apply_hard_bounds is True and xlim/ylim is set, in which case we limit the initial viewable range to xlim/ylim, but allow navigation up to the abs max between the data range and xlim/ylim.
- get_padding(obj, extents)[source]#
Computes padding along the axes taking into account the plot aspect.
- get_zorder(overlay, key, el)[source]#
Computes the z-order of element in the NdOverlay taking into account possible batching of elements.
- init_artists(ax, plot_data, plot_kwargs)[source]#
Initializes the artist based on the plot method declared on the plot.
- refresh(**kwargs)[source]#
Refreshes the plot by rerendering it and then pushing the updated data if the plot has an associated Comm.
- property state#
The plotting state that gets updated via the update method and used by the renderer to generate output.
- teardown_handles()[source]#
If no custom update_handles method is supplied this method is called to tear down any previous handles before replacing them.
- traverse(fn=None, specs=None, full_breadth=True)[source]#
Traverses any nested DimensionedPlot returning a list of all plots that match the specs. The specs should be supplied as a list of either Plot types or callables, which should return a boolean given the plot class.
- update(key)[source]#
Update the internal state of the Plot to represent the given key tuple (where integers represent frames). Returns this state.
- class holoviews.plotting.mpl.stats.SideBoxPlot(*args, **kwargs)[source]#
Bases:
AdjoinedPlot,BoxPlotParameters inherited from:
holoviews.plotting.plot.DimensionedPlot: fontsize, fontscale, title, normalizeholoviews.plotting.mpl.plot.MPLPlot: projection, backend_opts, fig_alpha, fig_bounds, fig_inches, fig_latex, fig_rcparams, fig_size, initial_hooks, sublabel_format, sublabel_position, sublabel_size, show_frameholoviews.plotting.plot.GenericElementPlot: apply_ranges, apply_extents, default_span, hooks, invert_axes, invert_xaxis, invert_yaxis, logx, logy, padding, show_legend, show_grid, xlabel, ylabel, xlim, ylim, zlim, xrotation, yrotation, xticks, yticksholoviews.plotting.mpl.element.ElementPlot: apply_ticks, data_aspect, invert_zaxis, labelled, logz, xformatter, yformatter, zformatter, zaxis, zlabel, zrotation, zticksholoviews.plotting.mpl.plot.AdjoinedPlot: show_title, aspect, subplot_size, show_xlabelbgcolor= param.Parameter(allow_refs=False, default=(1, 1, 1, 0), label=’Bgcolor’, nested_refs=False, rx=<param.reactive.reactive_ops object at 0x7f6aed518550>)Make plot background invisible.
xaxis= param.ObjectSelector(allow_refs=False, default=’bare’, label=’Xaxis’, names={}, nested_refs=False, objects=[‘top’, ‘bottom’, ‘bare’, ‘top-bare’, ‘bottom-bare’, None], rx=<param.reactive.reactive_ops object at 0x7f6aecef8b90>)Whether and where to display the xaxis, bare options allow suppressing all axis labels including ticks and xlabel. Valid options are ‘top’, ‘bottom’, ‘bare’, ‘top-bare’ and ‘bottom-bare’.
yaxis= param.ObjectSelector(allow_refs=False, default=’bare’, label=’Yaxis’, names={}, nested_refs=False, objects=[‘left’, ‘right’, ‘bare’, ‘left-bare’, ‘right-bare’, None], rx=<param.reactive.reactive_ops object at 0x7f6aecdaa610>)Whether and where to display the yaxis, bare options allow suppressing all axis labels including ticks and ylabel. Valid options are ‘left’, ‘right’, ‘bare’ ‘left-bare’ and ‘right-bare’.
border_size= param.Number(allow_refs=False, default=0, inclusive_bounds=(True, True), label=’Border size’, nested_refs=False, rx=<param.reactive.reactive_ops object at 0x7f6aed44dc90>)The size of the border expressed as a fraction of the main plot.
- anim(start=0, stop=None, fps=30)[source]#
Method to return a matplotlib animation. The start and stop frames may be specified as well as the fps.
- compute_ranges(obj, key, ranges)[source]#
Given an object, a specific key, and the normalization options, this method will find the specified normalization options on the appropriate OptionTree, group the elements according to the selected normalization option (i.e. either per frame or over the whole animation) and finally compute the dimension ranges in each group. The new set of ranges is returned.
- get_extents(element, ranges, range_type='combined', **kwargs)[source]#
Gets the extents for the axes from the current Element. The globally computed ranges can optionally override the extents.
The extents are computed by combining the data ranges, extents and dimension ranges. Each of these can be obtained individually by setting the range_type to one of:
‘data’: Just the data ranges
‘extents’: Element.extents
‘soft’: Dimension.soft_range values
‘hard’: Dimension.range values
To obtain the combined range, which includes range padding the default may be used:
‘combined’: All the range types combined and padding applied
This allows Overlay plots to obtain each range and combine them appropriately for all the objects in the overlay.
If lims_as_soft_ranges is set to True, the xlim and ylim will be treated as soft ranges instead of the default case as hard ranges while computing the extents. This is used e.g. when apply_hard_bounds is True and xlim/ylim is set, in which case we limit the initial viewable range to xlim/ylim, but allow navigation up to the abs max between the data range and xlim/ylim.
- get_padding(obj, extents)[source]#
Computes padding along the axes taking into account the plot aspect.
- get_zorder(overlay, key, el)[source]#
Computes the z-order of element in the NdOverlay taking into account possible batching of elements.
- init_artists(ax, plot_args, plot_kwargs)[source]#
Initializes the artist based on the plot method declared on the plot.
- refresh(**kwargs)[source]#
Refreshes the plot by rerendering it and then pushing the updated data if the plot has an associated Comm.
- property state#
The plotting state that gets updated via the update method and used by the renderer to generate output.
- teardown_handles()[source]#
If no custom update_handles method is supplied this method is called to tear down any previous handles before replacing them.
- traverse(fn=None, specs=None, full_breadth=True)[source]#
Traverses any nested DimensionedPlot returning a list of all plots that match the specs. The specs should be supplied as a list of either Plot types or callables, which should return a boolean given the plot class.
- update(key)[source]#
Update the internal state of the Plot to represent the given key tuple (where integers represent frames). Returns this state.
- class holoviews.plotting.mpl.stats.ViolinPlot(element, **params)[source]#
Bases:
BoxPlotBoxPlot plots the ErrorBar Element type and supporting both horizontal and vertical error bars via the ‘horizontal’ plot option.
Parameters inherited from:
holoviews.plotting.plot.DimensionedPlot: fontsize, fontscale, show_title, title, normalizeholoviews.plotting.mpl.plot.MPLPlot: projection, backend_opts, fig_alpha, fig_bounds, fig_inches, fig_latex, fig_rcparams, fig_size, initial_hooks, sublabel_format, sublabel_position, sublabel_size, show_frameholoviews.plotting.plot.GenericElementPlot: apply_ranges, apply_extents, bgcolor, default_span, hooks, invert_axes, invert_xaxis, invert_yaxis, logx, logy, padding, show_legend, show_grid, xaxis, yaxis, xlabel, ylabel, xlim, ylim, zlim, xrotation, yrotation, xticks, yticksholoviews.plotting.mpl.element.ElementPlot: apply_ticks, aspect, data_aspect, invert_zaxis, labelled, logz, xformatter, yformatter, zformatter, zaxis, zlabel, zrotation, zticksbandwidth= param.Number(allow_None=True, allow_refs=False, inclusive_bounds=(True, True), label=’Bandwidth’, nested_refs=False, rx=<param.reactive.reactive_ops object at 0x7f6aed49f290>)Allows supplying explicit bandwidth value rather than relying on scott or silverman method.
inner= param.ObjectSelector(allow_refs=False, default=’box’, label=’Inner’, names={}, nested_refs=False, objects=[‘box’, ‘medians’, None], rx=<param.reactive.reactive_ops object at 0x7f6aed49b450>)Inner visual indicator for distribution values: * box - A small box plot * stick - Lines indicating each sample value * quartiles - Indicates first, second and third quartiles
- anim(start=0, stop=None, fps=30)[source]#
Method to return a matplotlib animation. The start and stop frames may be specified as well as the fps.
- compute_ranges(obj, key, ranges)[source]#
Given an object, a specific key, and the normalization options, this method will find the specified normalization options on the appropriate OptionTree, group the elements according to the selected normalization option (i.e. either per frame or over the whole animation) and finally compute the dimension ranges in each group. The new set of ranges is returned.
- get_extents(element, ranges, range_type='combined', **kwargs)[source]#
Gets the extents for the axes from the current Element. The globally computed ranges can optionally override the extents.
The extents are computed by combining the data ranges, extents and dimension ranges. Each of these can be obtained individually by setting the range_type to one of:
‘data’: Just the data ranges
‘extents’: Element.extents
‘soft’: Dimension.soft_range values
‘hard’: Dimension.range values
To obtain the combined range, which includes range padding the default may be used:
‘combined’: All the range types combined and padding applied
This allows Overlay plots to obtain each range and combine them appropriately for all the objects in the overlay.
If lims_as_soft_ranges is set to True, the xlim and ylim will be treated as soft ranges instead of the default case as hard ranges while computing the extents. This is used e.g. when apply_hard_bounds is True and xlim/ylim is set, in which case we limit the initial viewable range to xlim/ylim, but allow navigation up to the abs max between the data range and xlim/ylim.
- get_padding(obj, extents)[source]#
Computes padding along the axes taking into account the plot aspect.
- get_zorder(overlay, key, el)[source]#
Computes the z-order of element in the NdOverlay taking into account possible batching of elements.
- init_artists(ax, plot_args, plot_kwargs)[source]#
Initializes the artist based on the plot method declared on the plot.
- refresh(**kwargs)[source]#
Refreshes the plot by rerendering it and then pushing the updated data if the plot has an associated Comm.
- property state#
The plotting state that gets updated via the update method and used by the renderer to generate output.
- teardown_handles()[source]#
If no custom update_handles method is supplied this method is called to tear down any previous handles before replacing them.
- traverse(fn=None, specs=None, full_breadth=True)[source]#
Traverses any nested DimensionedPlot returning a list of all plots that match the specs. The specs should be supplied as a list of either Plot types or callables, which should return a boolean given the plot class.
- update(key)[source]#
Update the internal state of the Plot to represent the given key tuple (where integers represent frames). Returns this state.
tabular Module#

- class holoviews.plotting.mpl.tabular.TablePlot(table, **params)[source]#
Bases:
ElementPlotA TablePlot can plot both TableViews and ViewMaps which display as either a single static table or as an animated table respectively.
Parameters inherited from:
holoviews.plotting.plot.DimensionedPlot: fontsize, fontscale, show_title, title, normalizeholoviews.plotting.mpl.plot.MPLPlot: projection, backend_opts, fig_alpha, fig_bounds, fig_inches, fig_latex, fig_rcparams, fig_size, initial_hooks, sublabel_format, sublabel_position, sublabel_size, show_frameholoviews.plotting.plot.GenericElementPlot: apply_ranges, apply_extents, bgcolor, default_span, hooks, invert_axes, invert_xaxis, invert_yaxis, logx, logy, padding, show_legend, show_grid, xaxis, yaxis, xlabel, ylabel, xlim, ylim, zlim, xrotation, yrotation, xticks, yticksholoviews.plotting.mpl.element.ElementPlot: apply_ticks, aspect, data_aspect, invert_zaxis, labelled, logz, xformatter, yformatter, zformatter, zaxis, zlabel, zrotation, zticksborder= param.Number(allow_refs=False, bounds=(0.0, 0.5), default=0.05, inclusive_bounds=(True, True), label=’Border’, nested_refs=False, rx=<param.reactive.reactive_ops object at 0x7f6aec0c1110>)The fraction of the plot that should be empty around the edges.
float_precision= param.Integer(allow_refs=False, default=3, inclusive_bounds=(True, True), label=’Float precision’, nested_refs=False, rx=<param.reactive.reactive_ops object at 0x7f6aec0c2e50>)The floating point precision to use when printing float numeric data types.
max_value_len= param.Integer(allow_refs=False, default=20, inclusive_bounds=(True, True), label=’Max value len’, nested_refs=False, rx=<param.reactive.reactive_ops object at 0x7f6aec0c1050>)The maximum allowable string length of a value shown in any table cell. Any strings longer than this length will be truncated.
max_font_size= param.Integer(allow_refs=False, default=12, inclusive_bounds=(True, True), label=’Max font size’, nested_refs=False, rx=<param.reactive.reactive_ops object at 0x7f6aec0c2dd0>)The largest allowable font size for the text in each table cell.
max_rows= param.Integer(allow_refs=False, default=15, inclusive_bounds=(True, True), label=’Max rows’, nested_refs=False, rx=<param.reactive.reactive_ops object at 0x7f6aec0c3190>)The maximum number of Table rows before the table is summarized.
font_types= param.Dict(allow_refs=False, class_=<class ‘dict’>, default={‘heading’: <matplotlib.font_manager.FontProperties object at 0x7f6aeeda1d10>}, label=’Font types’, nested_refs=False, rx=<param.reactive.reactive_ops object at 0x7f6aec0c2610>)The font style used for heading labels used for emphasis.
- anim(start=0, stop=None, fps=30)[source]#
Method to return a matplotlib animation. The start and stop frames may be specified as well as the fps.
- compute_ranges(obj, key, ranges)[source]#
Given an object, a specific key, and the normalization options, this method will find the specified normalization options on the appropriate OptionTree, group the elements according to the selected normalization option (i.e. either per frame or over the whole animation) and finally compute the dimension ranges in each group. The new set of ranges is returned.
- get_extents(element, ranges, range_type='combined', dimension=None, xdim=None, ydim=None, zdim=None, lims_as_soft_ranges=False, **kwargs)[source]#
Gets the extents for the axes from the current Element. The globally computed ranges can optionally override the extents.
The extents are computed by combining the data ranges, extents and dimension ranges. Each of these can be obtained individually by setting the range_type to one of:
‘data’: Just the data ranges
‘extents’: Element.extents
‘soft’: Dimension.soft_range values
‘hard’: Dimension.range values
To obtain the combined range, which includes range padding the default may be used:
‘combined’: All the range types combined and padding applied
This allows Overlay plots to obtain each range and combine them appropriately for all the objects in the overlay.
If lims_as_soft_ranges is set to True, the xlim and ylim will be treated as soft ranges instead of the default case as hard ranges while computing the extents. This is used e.g. when apply_hard_bounds is True and xlim/ylim is set, in which case we limit the initial viewable range to xlim/ylim, but allow navigation up to the abs max between the data range and xlim/ylim.
- get_padding(obj, extents)[source]#
Computes padding along the axes taking into account the plot aspect.
- get_zorder(overlay, key, el)[source]#
Computes the z-order of element in the NdOverlay taking into account possible batching of elements.
- init_artists(ax, plot_args, plot_kwargs)[source]#
Initializes the artist based on the plot method declared on the plot.
- refresh(**kwargs)[source]#
Refreshes the plot by rerendering it and then pushing the updated data if the plot has an associated Comm.
- property state#
The plotting state that gets updated via the update method and used by the renderer to generate output.
- teardown_handles()[source]#
If no custom update_handles method is supplied this method is called to tear down any previous handles before replacing them.
- traverse(fn=None, specs=None, full_breadth=True)[source]#
Traverses any nested DimensionedPlot returning a list of all plots that match the specs. The specs should be supplied as a list of either Plot types or callables, which should return a boolean given the plot class.
- update(key)[source]#
Update the internal state of the Plot to represent the given key tuple (where integers represent frames). Returns this state.
util Module#

- class holoviews.plotting.mpl.util.CFTimeConverter(*, interval_multiples=True)[source]#
Bases:
DateConverterDefines conversions for cftime types by extending nc_time_axis.
- axisinfo(unit, axis)[source]#
Return the ~matplotlib.units.AxisInfo for unit.
unit is a ~datetime.tzinfo instance or None. The axis argument is required but not used.
- class holoviews.plotting.mpl.util.EqHistNormalize(vmin=None, vmax=None, clip=False, rescale_discrete_levels=True, nbins=65536, ncolors=256)[source]#
Bases:
Normalize- process_value(data)[source]#
Homogenize the input value for easy and efficient normalization.
value can be a scalar or sequence.
Returns#
- resultmasked array
Masked array with the same shape as value.
- is_scalarbool
Whether value is a scalar.
Notes#
Float dtypes are preserved; integer types with two bytes or smaller are converted to np.float32, and larger types are converted to np.float64. Preserving float32 when possible, and using in-place operations, greatly improves speed for large arrays.
- holoviews.plotting.mpl.util.axis_overlap(ax1, ax2)[source]#
Tests whether two axes overlap vertically
- holoviews.plotting.mpl.util.filter_styles(style, group, other_groups, blacklist=None)[source]#
Filters styles which are specific to a particular artist, e.g. for a GraphPlot this will filter options specific to the nodes and edges.
Arguments#
- style: dict
Dictionary of styles and values
- group: str
Group within the styles to filter for
- other_groups: list
Other groups to filter out
- blacklist: list (optional)
List of options to filter out
Returns#
- filtered: dict
Filtered dictionary of styles
- holoviews.plotting.mpl.util.fix_aspect(fig, nrows, ncols, title=None, extra_artists=None, vspace=0.2, hspace=0.2)[source]#
Calculate heights and widths of axes and adjust the size of the figure to match the aspect.
- holoviews.plotting.mpl.util.get_raster_array(image)[source]#
Return the array data from any Raster or Image type
- holoviews.plotting.mpl.util.get_tight_bbox(fig, bbox_extra_artists=None, pad=None)[source]#
Compute a tight bounding box around all the artists in the figure.
- holoviews.plotting.mpl.util.is_color(color)[source]#
Checks if supplied object is a valid color spec.
- holoviews.plotting.mpl.util.polygons_to_path_patches(element)[source]#
Converts Polygons into list of lists of matplotlib.patches.PathPatch objects including any specified holes. Each list represents one (multi-)polygon.
- holoviews.plotting.mpl.util.resolve_rows(rows)[source]#
Recursively iterate over lists of axes merging them by their vertical overlap leaving a list of rows.
- holoviews.plotting.mpl.util.ring_coding(array)[source]#
Produces matplotlib Path codes for exterior and interior rings of a polygon geometry.
- holoviews.plotting.mpl.util.validate(style, value, vectorized=True)[source]#
Validates a style and associated value.
Arguments#
- style: str
The style to validate (e.g. ‘color’, ‘size’ or ‘marker’)
- value:
The style value to validate
- vectorized: bool
Whether validator should allow vectorized setting
Returns#
- valid: boolean or None
If validation is supported returns boolean, otherwise None
- holoviews.plotting.mpl.util.wrap_formatter(formatter)[source]#
Wraps formatting function or string in appropriate matplotlib formatter type.