Bounds#
Download this notebook from GitHub (right-click to download).
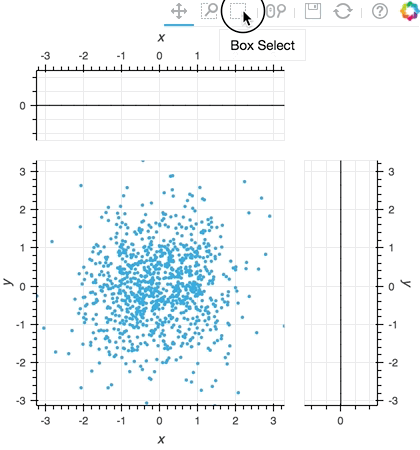
Title: Bounds & selection stream example#
Description: A linked streams example demonstrating how to use Bounds and Selection streams together.
Dependencies Bokeh
import numpy as np
import holoviews as hv
from holoviews import opts
from holoviews import streams
hv.extension('bokeh')


opts.defaults(opts.Histogram(framewise=True))

# Declare distribution of Points
points = hv.Points(np.random.multivariate_normal((0, 0), [[1, 0.1], [0.1, 1]], (1000,)))

# Declare points selection selection
sel = streams.Selection1D(source=points)

# Declare DynamicMap computing mean y-value of selection
mean_sel = hv.DynamicMap(lambda index: hv.HLine(points['y'][index].mean() if index else -10),
                         kdims=[], streams=[sel])

# Declare a Bounds stream and DynamicMap to get box_select geometry and draw it
box = streams.BoundsXY(source=points, bounds=(0,0,0,0))
bounds = hv.DynamicMap(lambda bounds: hv.Bounds(bounds), streams=[box])

# Declare DynamicMap to apply bounds selection
dmap = hv.DynamicMap(lambda bounds: points.select(x=(bounds[0], bounds[2]),
                                                  y=(bounds[1], bounds[3])),
                     streams=[box])

# Compute histograms of selection along x-axis and y-axis
yhist = hv.operation.histogram(dmap, bin_range=points.range('y'), dimension='y', dynamic=True, normed=False)
xhist = hv.operation.histogram(dmap, bin_range=points.range('x'), dimension='x', dynamic=True, normed=False)

# Combine components and display
points * mean_sel * bounds << yhist << xhist
This web page was generated from a Jupyter notebook and not all interactivity will work on this website. Right click to download and run locally for full Python-backed interactivity.
Download this notebook from GitHub (right-click to download).